

Zinger Key Points
- Delta Air Lines and United Airlines’ Death Crosses suggests potential declines ahead; caution advised.
- Short-term gains may not outweigh bearish long-term technical signals for both airlines.
- Feel unsure about the market’s next move? Copy trade alerts from Matt Maley—a Wall Street veteran who consistently finds profits in volatile markets. Claim your 7-Day free trial now.
As turbulence continues in the airline sector, Delta Air Lines Inc. DAL and United Airlines Inc. UAL have both recently formed a Death Cross on their stock charts — a bearish technical pattern that indicates potential trouble ahead.
Here's a closer look at what this means for investors and why these stocks might be headed for a bumpy ride.
A Death Cross occurs when a stock's short-term moving average crosses below its long-term moving average. This pattern is typically seen as a signal that the stock might experience further declines. In the case of Delta and United, both airlines are now showing this ominous formation, which could indicate a rough flight path ahead.
Delta Air Lines: A Cloudy Outlook
Delta's stock has been somewhat volatile recently.
While Delta stock is up 4.7% year-to-date, but it's down 2.04% over the past year. The airline has been grappling with the aftermath of a significant IT outage in July, which led to the cancellation of over 7,000 flights and has left a $380 million mark on its direct revenue.
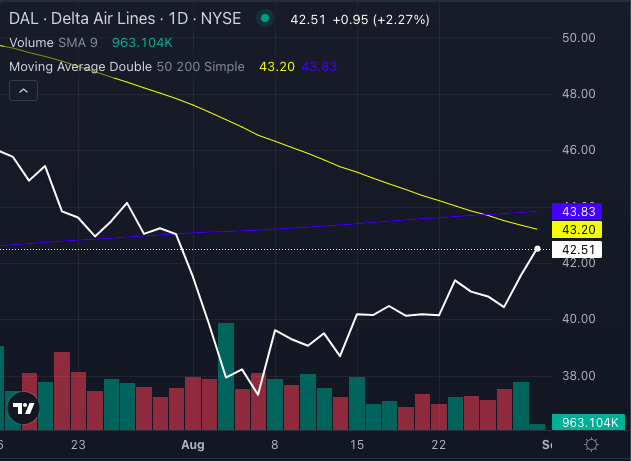
Chart created using Benzinga Pro
Technical Snapshot:
- Current Price: $42.51
- 8-Day SMA: $40.70
- 20-Day SMA: $39.79
- 50-Day SMA: $43.20
- 200-Day SMA: $43.83
Delta's recent stock price is hovering below its 50-day and 200-day SMAs, which, combined with the Death Cross formation, suggests further downside risk. The stock’s recent technical signals are mixed, with short-term indicators still showing some buying pressure, but long-term averages pointing to potential declines.
Read Also: Should You Invest in the iShares U.S. Aerospace & Defense ETF?
United Airlines: Facing Rough Air
United Airlines has also hit a Death Cross, adding to the airline sector's troubles.
Despite being up 7.00% year-to-date, the stock is down 13.03% over the past year and has faced recent issues, including turbulence-related injuries and a labor dispute with the Teamsters union.
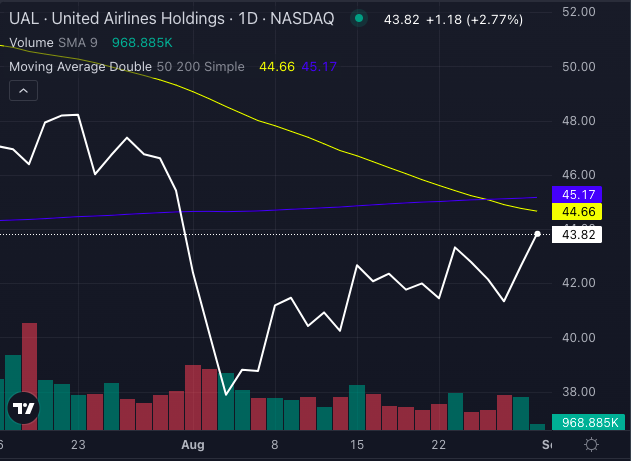
Chart created using Benzinga Pro
Technical Snapshot:
- Current Price: $43.82
- 8-Day SMA: $42.18
- 20-Day SMA: $41.22
- 50-Day SMA: $44.66
- 200-Day SMA: $45.17
Similar to Delta, United's technical indicators are showing a mixed picture. The short-term SMAs are bullish, but the longer-term averages are bearish, reinforcing the concern of a Death Cross.
The Bigger Picture: What To Watch
Investors should stay alert to broader market conditions and company-specific news. For Delta, resolution of IT issues and related financial impacts will be crucial. For United, labor disputes and operational challenges could be pivotal.
With the airline sector facing multiple headwinds, both Delta and United's current technical formations suggest caution.
While short-term buying signals might offer temporary relief, the longer-term outlook remains uncertain. This reflects broader market volatility and specific operational hurdles for these major carriers.
Read Next:
Image: Shutterstock
Edge Rankings
Price Trend
© 2025 Benzinga.com. Benzinga does not provide investment advice. All rights reserved.
Trade confidently with insights and alerts from analyst ratings, free reports and breaking news that affects the stocks you care about.

