
Zinger Key Points
- Match Group forms a bullish Golden Cross, signaling a potential upward trend for the online dating giant's stock.
- Technical indicators support Match Group's bullish momentum, with all major moving averages and MACD suggesting further upside potential.
- The ‘Trade of the Day’ is now live. Get a high-probability setup with clear entry and exit points right here.
Match Group Inc. MTCH — the owner of dating app services Tinder, Hinge, and OkCupid — has just seen its stock make a significant technical move.
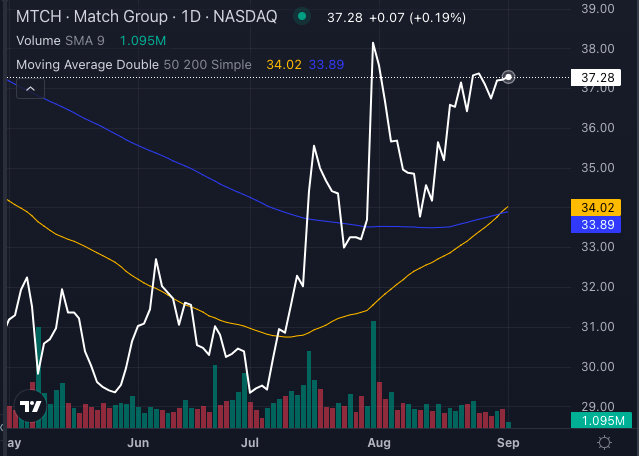
Chart created using Benzinga Pro
The stock has completed a Golden Cross, a bullish indicator that occurs when a short-term moving average crosses above a long-term moving average. This could be a promising signal for investors, especially considering the strong bullish momentum the stock has been experiencing.
Read Also: Struggling To Connect On Tinder, Grindr Or Bumble? Dating Apps Now Have An AI Wingman For You
A Golden Opportunity Or A Fling?
The Golden Cross typically signifies a shift from a bearish to a bullish trend, suggesting that Match’s stock might be gearing up for a positive run. Currently, the stock is trading at $37.31, which is above its five, 20 and 50-day exponential moving averages (EMAs). This positioning indicates that Match stock is experiencing strong buying pressure, adding further weight to the bullish case.
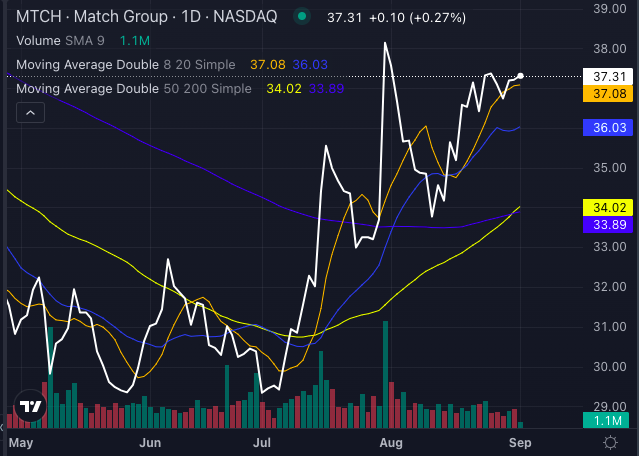
Chart created using Benzinga Pro
Match Group’s Chart Sends All The Right Signals
Several other technical indicators are aligning with this bullish sentiment:
- Moving Averages Point to Buy: Match Group's share price is currently above all major simple moving averages (SMAs). The eight-day SMA stands at $37.08, the 20-day SMA at $36.03, the 50-day SMA at $34.02 and the 200-day SMA at $33.89—all below the current share price of $37.31. This consistent upward trend across multiple time frames reinforces the idea that investors are optimistic about the stock’s near-term prospects.
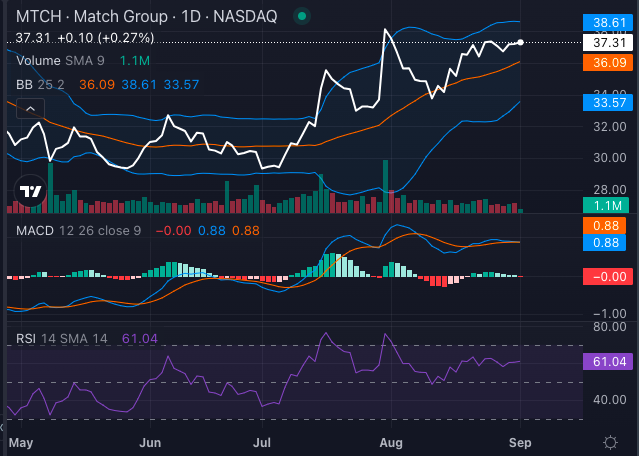
Chart created using Benzinga Pro
- MACD Shows Positive Momentum: The Moving Average Convergence Divergence (MACD) indicator for Match stock is at 0.88, further suggesting a bullish trend. This positive divergence hints that there could be more upside in store for Match Group if current momentum continues.
- RSI, Bollinger Bands Indicate Potential Overbought Condition Approaching: Match stock’s Relative Strength Index (RSI) is currently at 61.04, which is approaching the overbought zone. Additionally, the stock is trading in the upper bullish band of its Bollinger Bands (25), which range from $33.57 to $38.61. These indicators suggest that while the stock is currently in a bullish phase, it might be nearing a temporary peak.
Swipe Right On Match Group Stock?
With the Golden Cross and other bullish technical indicators, Match Group’s stock seems to be sending strong bullish signals. However, investors should keep an eye on potential overbought conditions approaching as suggested by the RSI and Bollinger Bands.
For now, though, the charts seem to be saying: swipe right!
Read Next:
Image: Solen Feyissa from Pixabay
Edge Rankings
Price Trend
© 2025 Benzinga.com. Benzinga does not provide investment advice. All rights reserved.
Trade confidently with insights and alerts from analyst ratings, free reports and breaking news that affects the stocks you care about.

