Zinger Key Points
- If understood and applied correctly, technical analysis will lead to profits.
- 'Ascending' and 'Descending Triangles' tend to be reliable patterns
- China’s new tariffs just reignited the same market patterns that led to triple- and quadruple-digit wins for Matt Maley. Get the next trade alert free.
Nvidia Corp NVDA shares surged on Tuesday following reports that CEO Jensen Huang completed selling company stock under a trading plan earlier than expected.
Huang's early exit from his Rule 10b5-1 trading plan, originally set to run through March 2025, signals potential market confidence, aligning with key technical patterns that suggest shifting investor sentiment.
Many technical analysts don't understand that technical analysis is, or should be, the study of investor and trader psychology. These misinformed analysts look at charts and try to identify patterns without understanding the dynamics and price action that make these patterns form.
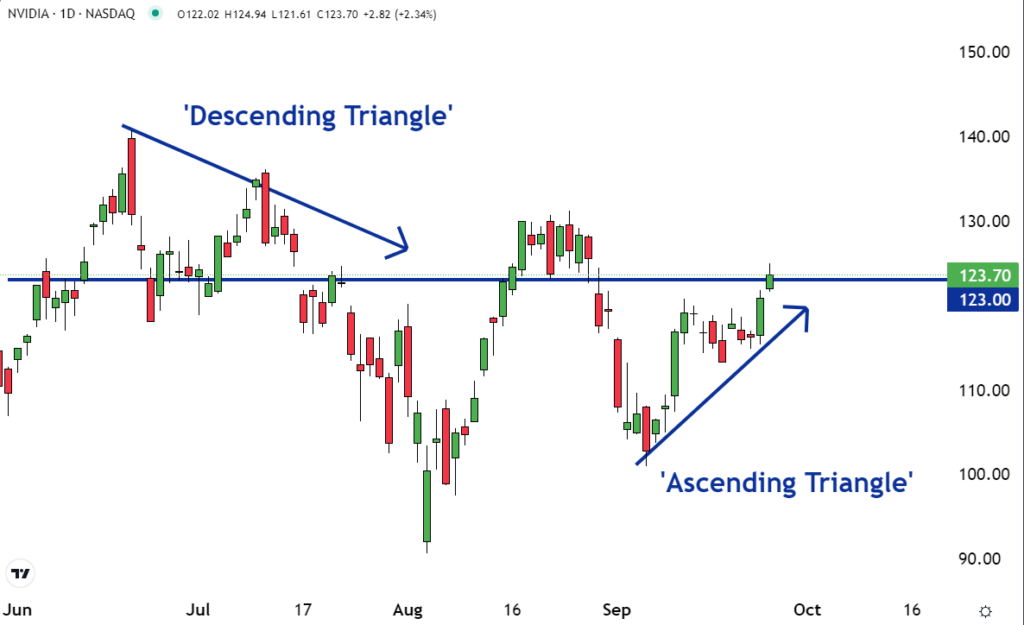
Ascending and descending triangles are traditional technical analysis patterns that tend to be reliable. Both of them are shown on the chart of Nvidia. That's why it is our Stock of the Day.
In June and July, a ‘descending triangle' formed on the chart on NVIDIA. This pattern is a graphical illustration of aggressive sellers and complacent or patient buyers.

The buyers were willing to wait for the sellers to come to them. They were content to stay around the $123 level, which is why, as time passed, the support line on the lower part of the pattern became horizontal.
But over the same time, the sellers became more aggressive. They were willing to sell at lower prices. This is why the resistance line at the top of the pattern was descending or slanted lower.
Aggressive selling and patient buying set the stage for a stock to move lower. This is why the descending triangle is a bearish pattern, suggesting that NVIDIA was going to break the support line and move lower, which is what happened.
Now an ascending triangle pattern has formed on the chart. This is an illustration of the opposite dynamics that make a descending triangle pattern form.
In this case, as time has gone by it's the sellers who have been patient. They have been willing to remain at their prices and let the buyers come to them. This is why the resistance line at the top of the pattern is horizontal.
But over the same time, the buyers became increasingly aggressive. They were willing to pay higher prices. This is why the support line of the pattern is ascending or slanted upwards.
Aggressive buyers and patient sellers are dynamics that tend to be bullish for a market. It could mean that NVIDIA will break the resistance around $123 and rally.
If understood and applied correctly, technical analysis is a study of investor and trader psychology.
A descending triangle illustrates aggressive sellers and complacent buyers, often setting the stage for a move lower. An ascending triangle illustrates aggressive buyers and complacent sellers, potentially leading to a move higher.
Successful traders understand the psychology and price action that makes technical analysis patterns form on charts. This is why they make money.
Read Next:
Photo: Shutterstock
Edge Rankings
Price Trend
© 2025 Benzinga.com. Benzinga does not provide investment advice. All rights reserved.
Trade confidently with insights and alerts from analyst ratings, free reports and breaking news that affects the stocks you care about.