Zinger Key Points
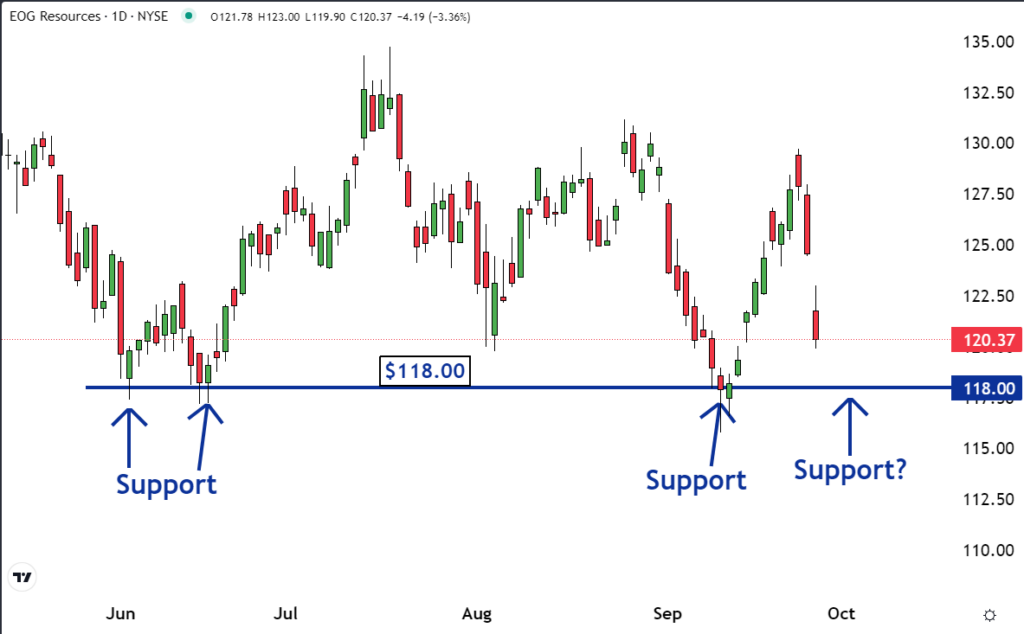
- The has been support around the $118.00 level for shares of EOG Resources (EOG) since June.
- Market psychology drives patterns, making support levels repeat across different securities’ charts.
- Get two weeks of free access to pro-level trading tools, including news alerts, scanners, and real-time market insights.
Technical analysis patterns form on charts because of investor and trader psychology. This is why the same patterns appear on the charts of different securities. The securities may be different, but the psychology of the people who are trading them is the same.
For example, markets tend to find support at price levels that had been support before. This happens because of remorseful sellers. As you can see on the chart, shares of EOG Resources, Inc. EOG found support at the $118 level three times since June. If the stock keeps heading lower, there is a good chance it finds support again.

Read Also: Is SMCI’s Big Drop A Warning Sign Or Buying Opportunity? Here’s What Professional Traders Say
There were traders and investors who sold shares while the stock was at this support. But after it rallied, they regretted selling. Many of these remorseful sellers decided to buy their shares back, but they didn't want to pay a higher price than they sold them for.
As a result, after the moves higher, when the stock eventually reversed and got back to $118, they placed buy orders. There were so many of these orders that support formed at the price that had been support before.
Stocks often rally after hitting support levels, driven in part by market psychology. Anxious buyers anticipate that sellers will sell to the highest bidder, so they begin raising their offers. As other buyers observe this behavior, they too increase the prices they are willing to pay, further driving the rally.
This can result in a bidding war, pushing the price higher. If EOG reaches $118, there is a good chance it will happen again.
The best traders recognize the crucial role of market psychology. They understand that sellers’ remorse can reinforce previous support levels, and stocks often rally from these levels as anxious buyers step in.
Read Next:
Image created using artificial intelligence via Midjourney.
© 2025 Benzinga.com. Benzinga does not provide investment advice. All rights reserved.
Trade confidently with insights and alerts from analyst ratings, free reports and breaking news that affects the stocks you care about.