Zinger Key Points
- Boeing faces production delays and supply chain issues, contributing to its 36.64% YTD stock decline.
- Technical indicators present mixed signals; short-term SMAs suggest potential rebounds, while long-term trends remain bearish.
- Pelosi’s latest AI pick skyrocketed 169% in just one month. Click here to discover the next stock our government trade tracker is spotlighting—before it takes off.
Editor’s note: This story has been updated to correct Street estimates for Boeing’s third-quarter earnings report.
Boeing Co. BA is set to report third-quarter earnings on Wednesday before the market opens. Analysts are expecting a loss of $8.11 per share and quarterly revenue of $17.9 billion, according to Benzinga Pro.
Investors, on the other hand, are more focused on whether Boeing can navigate out of the turbulence that sent its stock down 36.64% year-to-date.
Boeing’s Downslide: Troubles In The Skies
Boeing's stock has been battered this year, largely due to persistent production issues and delivery delays for its 737 MAX and 787 Dreamliner jets. Supply chain snags and quality control problems have plagued the aerospace giant, hindering its ability to meet growing demand from airlines.
A recent glitch in its KC-46 tanker program has added fuel to the fire, leaving investors jittery about Boeing's ability to turn things around.
The company’s struggles are reflected in its underperformance over the past year, with a 11.88% decline in share price.
Read Also: Boeing Stock Rises Ahead Of Wednesday’s Union Vote: Will Investors Breathe ‘A Sigh Of Relief?’
Mixed Signals From Boeing's Stock Charts
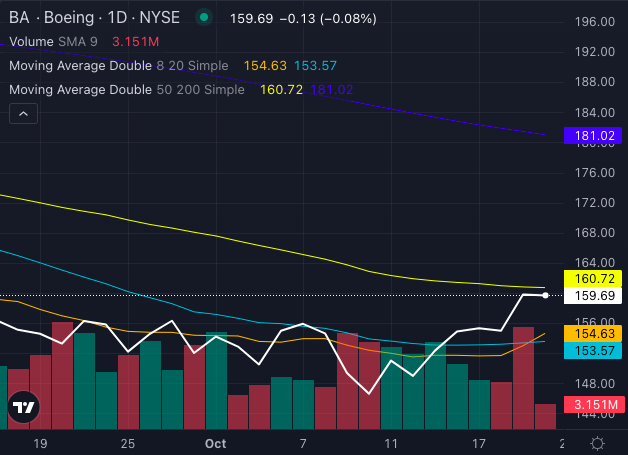
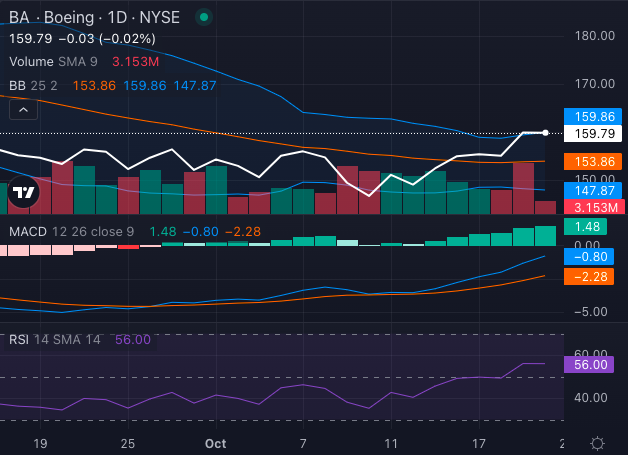
On the charts, Boeing’s stock is sending mixed signals.

Chart created using Benzinga Pro
Boeing’s stock price of $159.69 hovers slightly below its 50-day moving average of $160.72, creating a bearish signal, while it trades well below its 200-day average of $181.02, also bearish, long-term.

Chart created using Benzinga Pro
The Moving Average Convergence Divergence (MACD) indicator is at negative 0.80, suggesting downward momentum. Additionally, the Relative Strength Index (RSI) of 56.00 indicates Boeing stock might be heading toward the overbought territory, further pointing to caution.
Not all is bearish. The eight-day simple moving average of $152.26 and the 20-day SMA of $153.43 both suggest a short-term buy opportunity, hinting that Boeing stock could bounce back after recent selling pressure.
Q3 Earnings Outlook: Time to Watch The Skies
Investors will be watching Boeing’s earnings closely for any signs of improvement in production or guidance on tackling its ongoing issues.
With expectations of negative earnings, the focus will be on management’s forward-looking statements and any updates on resolving supply chain bottlenecks.
Read Next:
Photo: Shutterstock
Edge Rankings
Price Trend
© 2025 Benzinga.com. Benzinga does not provide investment advice. All rights reserved.
Trade confidently with insights and alerts from analyst ratings, free reports and breaking news that affects the stocks you care about.