Zinger Key Points
- Technical analysis is the study of levels, trends, momentum, and psychology.
- This common-sense and logical approach can leads to profits.
- Today's manic market swings are creating the perfect setup for Matt’s next volatility trade. Get his next trade alert for free, right here.
There are a lot of myths and misunderstandings when it comes to technical analysis. Many analysts overthink things. Even worse, some are proponents of bizarre methods that are more science fiction than legitimate market analysis.
If understood and applied correctly, technical analysis is the study of price levels, trends, momentum, and psychology.
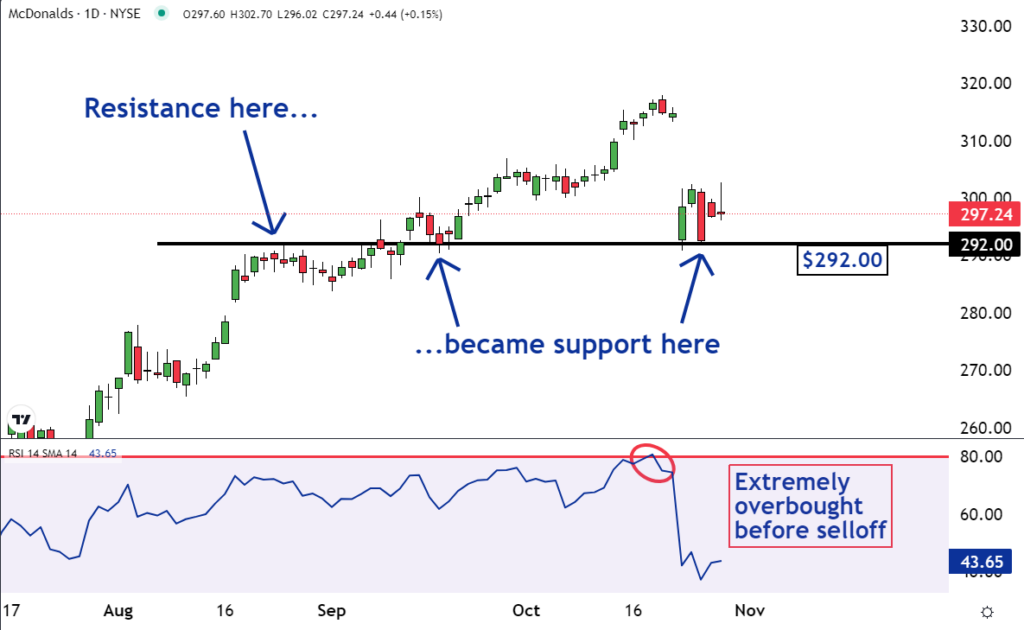
Despite reporting earnings, these four dynamics are illustrated on the chart of McDonald’s Corporation MCD. This is why our team of technical analysts has made it our Stock of the Day.
The term ‘overbought' refers to a stock's momentum, or how much it has moved in a given period. For the most part, a stock stays within its normal or typical trading range.
But if buyers become extremely emotional and aggressive, they can push the price above this range. This is important because it will draw sellers into the market. They will be expecting a reversion to the mean, or a move lower. Their selling can put pressure on the stock and it may become a self-fulfilling prophecy.

Read Also: US Stocks Mixed; McDonald’s Posts Upbeat Earnings
The lower part of the chart is the Relative Strength Index (RSI) momentum indicator. If the blue line is above the horizontal red line, it indicates overbought conditions. As you can see this was the case just before McDonald’s recent selloff.
Also, apparent on the chart is the importance of the $292 level. In August, it was resistance. Now it is a support level.
Investor and trader psychology can turn what had been resistance into support. This occurs because there are people who sold while the shares were at resistance who came to regret doing so when the price eventually moved higher.
Some of these remorseful sellers decide to buy their shares back, if they can do so at the same price they sold them for. As a result, when the stock eventually returns to the selling price they place buy orders.
If there are enough of these buy orders, it will form support at the same price that had been resistance. This is what happened at the $292 level for McDonalds.
The best traders don't overthink things. They focus on important levels, trends, and momentum. This common-sense approach can lead to profits.
Read Next:
Image: McDonald’s
Edge Rankings
Price Trend
© 2025 Benzinga.com. Benzinga does not provide investment advice. All rights reserved.
Trade confidently with insights and alerts from analyst ratings, free reports and breaking news that affects the stocks you care about.