Zinger Key Points
- NXP’s new AI tools aim to enhance machine learning deployment across edge processors.
- Analysts predict a 13.85% upside for NXPI stock despite current bearish trends.
- Feel unsure about the market’s next move? Copy trade alerts from Matt Maley—a Wall Street veteran who consistently finds profits in volatile markets. Claim your 7-day free trial now.
NXP Semiconductors NV NXPI will be reporting its third-quarter earnings on Monday. Wall Street expects $3.43 in EPS and $3.25 billion in revenues as the company reports after market hours.
The Dutch semiconductor powerhouse, known for its innovative product lineup — including microcontrollers and the i.MX family of application processors — recently announced enhancements to its eIQ AI and machine learning development software.
The new eIQ Time Series Studio and GenAI Flow tools are designed to simplify AI deployment across edge processors, further solidifying NXP's place in the tech landscape.
The stock is up 30.52% over the past year, 7.87% year-to-date.
Read Also: $100 Invested In NXP Semiconductors 10 Years Ago Would Be Worth This Much Today
Let’s look at what the charts indicate for NXPI stock and how the stock currently maps against Wall Street estimates.
NXPI Stock Chart Bearish Ahead Of Q3 Earnings
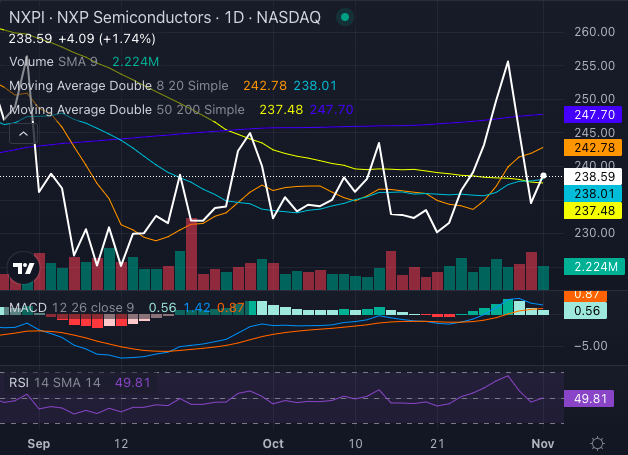
NXPI stock is riding a strongly bearish trend. Its share price of $238.59 remains below the five, 20 and 50-day Exponential Moving Averages (EMA), signaling sustained selling pressure.

Chart created using Benzinga Pro
However, the short-term technical picture is a mixed bag. With NXPI’s eight-day Simple Moving Average (SMA) at $242.78, a bearish tone prevails. Yet, the 20-day SMA sits just below the current price at $238.01, flashing a bullish signal, as does the 50-day SMA of $237.48, indicating a slight technical rebound.
Conversely, the long-term 200-day SMA at $247.70 reinforces the broader bearish stance.
Supporting this mixed scenario, the Moving Average Convergence Divergence (MACD) indicator of 1.42 shows bullish momentum, while a Relative Strength Index (RSI) reading of 49.81, and declining, suggests that NXPI stock is headings towards being oversold.
With indicators sending both bearish and bullish signals, NXP's chart implies potential upside for patient investors if buying pressure can overcome the current bearish trend.
NXPI Analysts See 13.85% Upside
Ratings & Consensus Estimates: The consensus analyst rating on NXPI stock stands at a Buy currently with a price target of $273. The latest analyst ratings from Stifel, Cantor Fitzgerald and UBS give NXP Semiconductors’ stock an average price target of $271.67, implying a 13.85% upside.
Price Action: NXPI stock closed the trading day Friday at $238.59, up 1.74%.
Read Next:
Image: NXP Semiconductors
Edge Rankings
Price Trend
© 2025 Benzinga.com. Benzinga does not provide investment advice. All rights reserved.
Trade confidently with insights and alerts from analyst ratings, free reports and breaking news that affects the stocks you care about.