Zinger Key Points
- Shopify's stock uptrend powers on, with shares 47.31% higher year-over-year.
- Analysts set an average price target of $90.
- Feel unsure about the market’s next move? Copy trade alerts from Matt Maley—a Wall Street veteran who consistently finds profits in volatile markets. Claim your 7-day free trial now.
Shopify Inc SHOP will be reporting its third-quarter earnings on Tuesday. Wall Street expects 27 cents in EPS and $2.11 billion in revenues as the company reports before market hours.
The stock is up 47.31% over the past year, 24.38% YTD.
Let’s look at what the charts indicate for Shopify stock and how the stock currently maps against Wall Street estimates.
Shopify Technical Setup Ahead Of Q3 Earnings
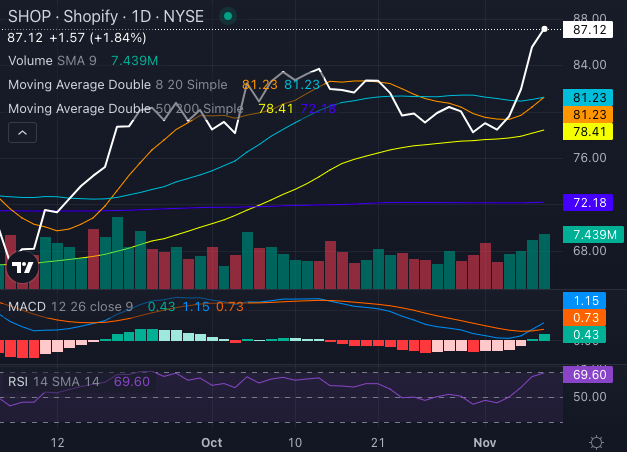
Shopify's stock has surged past its key moving averages, cementing a strong bullish trend that's drawing in buyers.

Chart created using Benzinga Pro
With the share price at $87.12, comfortably above its five-, 20- and 50-day exponential moving averages, Shopify stock's uptrend is powered by a steady wave of buying pressure.
Key technicals light up green: an eight-day SMA of $81.23 and a 20-day SMA of $81.23 signal bullish territory, while the 50-day SMA at $78.41 supports continued upside. Even the 200-day SMA at $72.18 lags far below, underscoring Shopify's robust momentum.
The MACD's positive 1.15 backs this rally, though the high RSI at 69.6 suggests it's nearing overbought territory, hinting that bulls might soon take a breather.
Shopify Analysts Consensus Ratings
Ratings & Consensus Estimates: The consensus analyst rating on Shopify stock stands at a Buy currently with a price target of $78.93. The latest ratings from Scotiabank, RBC Capital and Loop Capital give Shopify stock an average price target of $90, implying a slight downside of -1.3%.
SHOP Price Action: Shopify stock was trading up 4.07% at $90.66 at the time of publication Monday.
Read Next:
Photo: Shutterstock
Edge Rankings
Price Trend
© 2025 Benzinga.com. Benzinga does not provide investment advice. All rights reserved.
Trade confidently with insights and alerts from analyst ratings, free reports and breaking news that affects the stocks you care about.