Zinger Key Points
- Home Deport (HD) posted strong quarterly earnings and revenue.
- The recent price action may suggest a continued move higher.
- Our government trade tracker caught Pelosi’s 169% AI winner. Discover how to track all 535 Congress member stock trades today.
The Home Depot, Inc. HD is trading higher after posting strong earnings. The company reported $3.78 per share on revenues of $40.22 billion. Both of these were higher than estimates. Home Depot also said it is projecting comparable sales to fall by 2.5%, instead of the previously anticipated 3% to 4%.
In addition to these strong fundamentals, the stock may have just had a classic technical analysis buy signal. This is why it is our Stock of the Day.
A simple moving average price is the average of recent closing prices. For example, a 20-day simple moving average is the average closing price of the prior 20 days. A 30-day simple moving average is the average closing price of the previous thirty days, and so on.
Read Also: Home Depot, Tyson Foods And 3 Stocks To Watch Heading Into Tuesday
If the short-term moving average price of a stock is greater than a longer-term moving average price, there is a good chance the stock is in an uptrend. If a short-term moving average price is lower than a longer-term average price, there is a good chance the shares are moving lower.
Moving average crossover strategies are very common on Wall Street. They are entirely objective and easy to backtest.
With these strategies, a buy signal is given when a short-term moving average crosses above a longer-term average. If this action occurs, there is a good chance a new uptrend is forming.
A sell signal is generated if the short-term average price crosses below a longer-term one. If this happens, there is a good chance that a downtrend is forming.

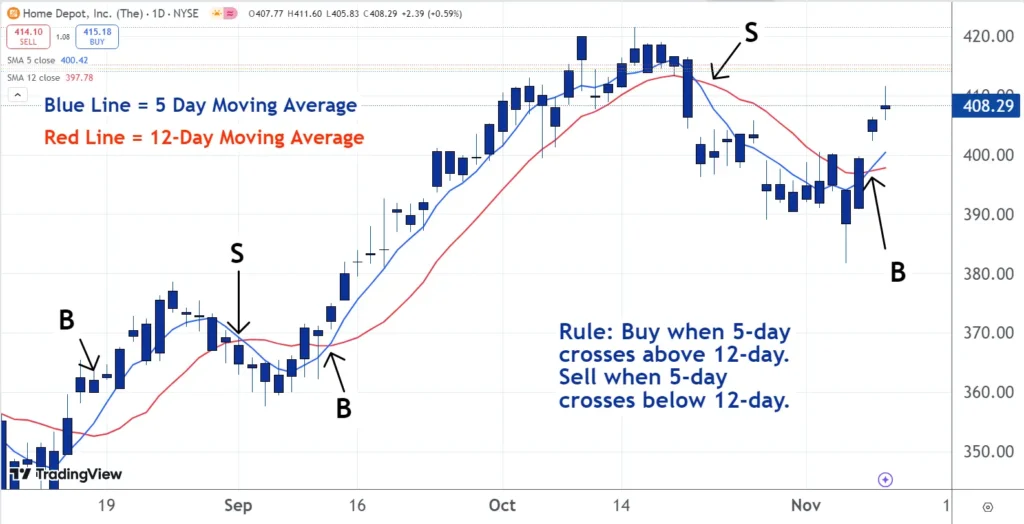
On the Home Depot chart, the blue line is the 5-day moving average and the red line is the 12-day average. In August a buy signal was given when the shares were trading around $362. A sell signal was given in September when they were close to $368.
Then in mid-September, a buy signal was given around $373. On October 22, a sell signal was given when the stock was trading around the $400 level.
As you can see, a buy signal was given three days ago. The 5-day simple moving average has once again crossed above the 12-day. This could mean a new uptrend is in the process of forming.
Read Next:
Photo: Shutterstock
© 2025 Benzinga.com. Benzinga does not provide investment advice. All rights reserved.
Trade confidently with insights and alerts from analyst ratings, free reports and breaking news that affects the stocks you care about.