Zinger Key Points
- Applied Materials stock shows bearish signals ahead of Thursday’s earnings, trading below key moving averages.
- Analysts see a 9.23% upside for AMAT, despite technical indicators suggesting caution in the near term.
- Pelosi’s latest AI pick skyrocketed 169% in just one month. Click here to discover the next stock our government trade tracker is spotlighting—before it takes off.
Wall Street expects Applied Materials Inc AMAT to report $2.19 in earnings per share and $6.95 billion in revenues when the company posts fourth-quarter earnings after market hours.
The stock is up 20.48% over the past year and 20.25% year-to-date.
Let’s look at what the charts indicate for Applied Materials stock and how the stock currently maps against Wall Street estimates.
Applied Materials Technical Setup Ahead Of Q4 Earnings
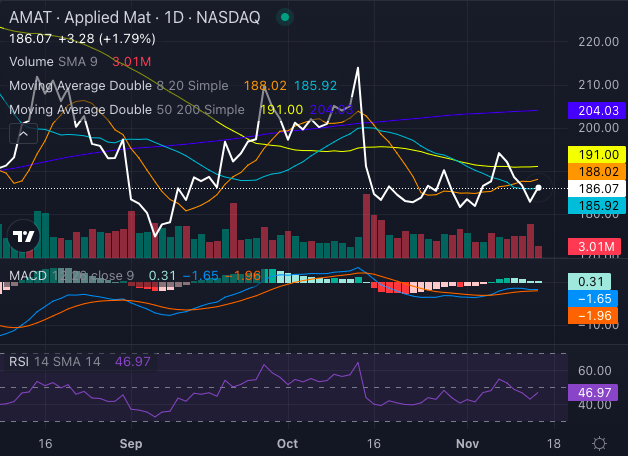
Applied Materials stock is currently showing signs of a bearish trend, with the stock trading below its key exponential moving averages (five, 20 and 50-day), indicating continued selling pressure and potential downside.

Chart created using Benzinga Pro
Applied Materials stock price of $186.07 has fallen below several crucial simple moving averages (eight-day at $188.02, 20-day at $185.92, 50-day at $191 and 200-day at $204.03), each presenting a bearish signal.
The MACD (moving average convergence/divergence) reading of negative 1.65 supports this view, suggesting downside momentum.
Meanwhile, the RSI at 46.97 indicates AMAT stock is nearing oversold territory, potentially signaling short-term relief.
However, technical indicators broadly suggest caution for now.
Applied Materials See 9% Upside
Ratings & Consensus Estimates: The consensus analyst rating on Applied Materials stock stands at a Buy currently with a price target of $214.89. The latest analyst ratings from Stifel and Susquehanna give Applied Materials stock an average price target of $203.33, suggesting a potential 9.23% upside.
Price Action: Applied Materials stock was trading at $185.75 at the time of publication.
Read Next:
Image: Shutterstock
Edge Rankings
Price Trend
© 2025 Benzinga.com. Benzinga does not provide investment advice. All rights reserved.
Trade confidently with insights and alerts from analyst ratings, free reports and breaking news that affects the stocks you care about.