Zinger Key Points
- C3.ai stock is riding bullish momentum, outperforming all major moving averages ahead of Q2 earnings.
- Analyst ratings imply a 7.99% downside, despite AI stock trading near $42 with overbought RSI levels.
- NOW OPEN: 200 Charter Memberships to Benzinga Trade Alerts
Wall Street expects C3.ai Inc AI to report a 16-cent loss per share for the second quarter, and $91.03 million in revenues, when it discloses earnings on Monday after market hours.
The company’s stock is up 43.94% over the past year and 29.21% over the past six months.
Let’s look at what the charts indicate for C3.ai, and how the stock currently maps against Wall Street’s estimates.
Read Also: C3.ai Earnings Are Imminent; These Most Accurate Analysts Revise Forecasts Ahead Of Earnings Call
C3.ai Shows Strong Bullish Momentum
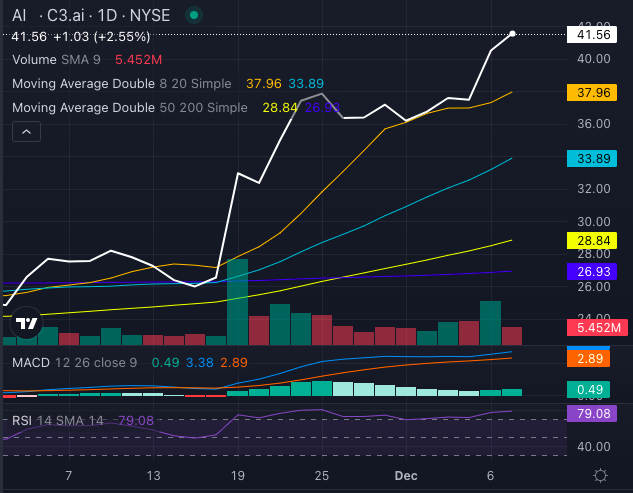
C3.ai stock is showing strong bullish momentum ahead of its second-quarter earnings, trading well above its five, 20 and 50-day exponential moving averages.

Chart created using Benzinga Pro
C3.ai stock, at $41.56, is outperforming its eight-day simple moving average (SMA) of $37.96, 20-day SMA of $33.89 and 50-day SMA of $28.84, signaling sustained buying pressure. The 200-day SMA of $26.93 further confirms the bullish outlook.
The moving average convergence/divergence (MACD) indicator at 3.38 supports the buying sentiment. However, with the relative strength index (RSI) at 79.08, the stock is in the overbought territory, suggesting caution for any potential pullbacks post-earnings.
C3.ai Analysts See 8% Downside
Ratings & Consensus Estimates: The consensus analyst rating on C3.ai stock stands at a Neutral currently with a price target of $26.17. Recent ratings from DA Davidson, Oppenheimer and JMP Securities imply a 7.99% downside for C3.ai stock, with a $38.33 target.
Price Action: C3.ai stock was trading at $42 at the time of publication.
Read Next:
Image: Shutterstock
© 2025 Benzinga.com. Benzinga does not provide investment advice. All rights reserved.
Trade confidently with insights and alerts from analyst ratings, free reports and breaking news that affects the stocks you care about.