Zinger Key Points
- These charts of CrowdStrike (CRWD) illustrate the fractal nature of technical analysis.
- The same patterns can appear on charts that have different time scales.
- Get daily trade setups, exclusive stock picks, and real-time alerts today.
Shares of CrowdStrike Holdings, Inc. CRWD are trading down sharply on Friday. The move lower was triggered by news of insider selling.
The stock teaches an important technical analysis lesson. This is why it is our Stock of the Day.
One of the most interesting and misunderstood dynamics of technical analysis is its fractal nature. This means the same patterns can be seen on charts of different timeframes.
In the stock market, there tends to be support at price levels that had been support previously. This is because of psychology. It is due to remorseful sellers.
These are people who sold shares while the stock was at support that regretted doing so when the price rallied soon after. Many of them decide to buy their shares back if they can get them at the same price they were sold for.
As a result, when the price drops back to the level that was support, they place buy orders. If there are enough of these buy orders it will form support at the level again.
Read Also: Airline Stocks Outperform Tech In 2024: Holiday Travel ‘Expected To See Records This Year’
As you can see on the 4-month chart, there has been support around the $345.00 level for CrowdStrike. This is a graphical illustration of the sellers' remorse of swing traders. These traders typically have time horizons of a few weeks or months.

4-month chart
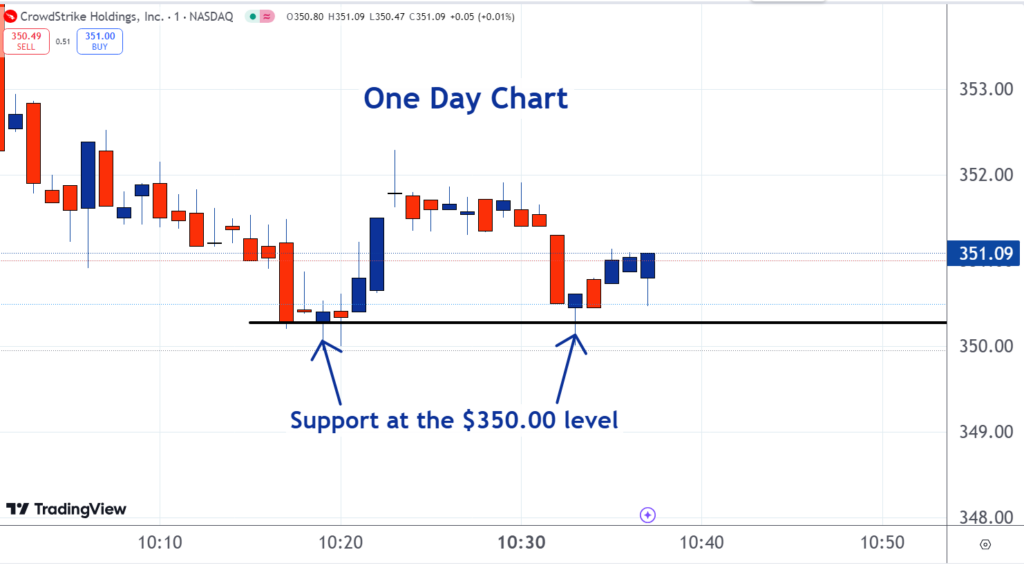
One-Day Chart
The same type of action can be seen on a one-day chart. The $350.00 has been support. This is a graphical illustration of sellers' remorse of traders that have short-term time horizons. This support was created by day traders.

Technical analysis has a dubious reputation on Wall Street. This shouldn't be surprising. Many analysts don't understand some of the basic principles.
If understood and applied correctly, technical analysis is the study of investor and trader psychology. Charts are graphical illustrations of this psychology.
Regardless of the timeframe of a strategy that is being traded, the people who are doing the trading experience the same emotions. These are what appear on charts. This is why the same patterns appear of charts that have different time horizons.
Read Next:
Image: Shutterstock
© 2025 Benzinga.com. Benzinga does not provide investment advice. All rights reserved.
Trade confidently with insights and alerts from analyst ratings, free reports and breaking news that affects the stocks you care about.