


Zinger Key Points
- Shares of KLA Corporation (KLAC) are extremely overbought.
- There is a good chance that they will soon sell off.
- Feel unsure about the market’s next move? Copy trade alerts from Matt Maley—a Wall Street veteran who consistently finds profits in volatile markets. Claim your 7-day free trial now.
KLA Corporation KLAC shares are ripping higher on Thursday. They are trading in sympathy with Taiwan Semiconductor Manufacturing Company Limited TSM, which reported earnings ahead of estimates.
But KLA Corporation may be about to reverse and head lower. This is why our team of technical analysts has made it our Stock of the Day.
Momentum is a measurement of how far a stock has moved up or down in a given period of time. Most of the time, a stock will stay in its typical or usual trading range.
If sellers are aggressive and push the price below this range, traders say it is oversold. If buyers push the price above the range, traders say it is overbought.
These are important dynamics. Many trading strategies are based on the concept of reversion to the mean. Stocks that are overbought or oversold tend to reverse back into their average trading ranges.
There are dozens and maybe even hundreds of different ways to measure a stock's momentum. These are called momentum indicators or oscillators.
Read Also: Tesla Stock ‘Valuation Is Full’: Analyst Flags Long-Term Growth Opportunities With Robotaxis, FSD
Some new traders make the mistake of using too many of these indicators. They believe that the more they study, the better their results will be.
But sometimes a trader would be better off just using a few and mastering them.
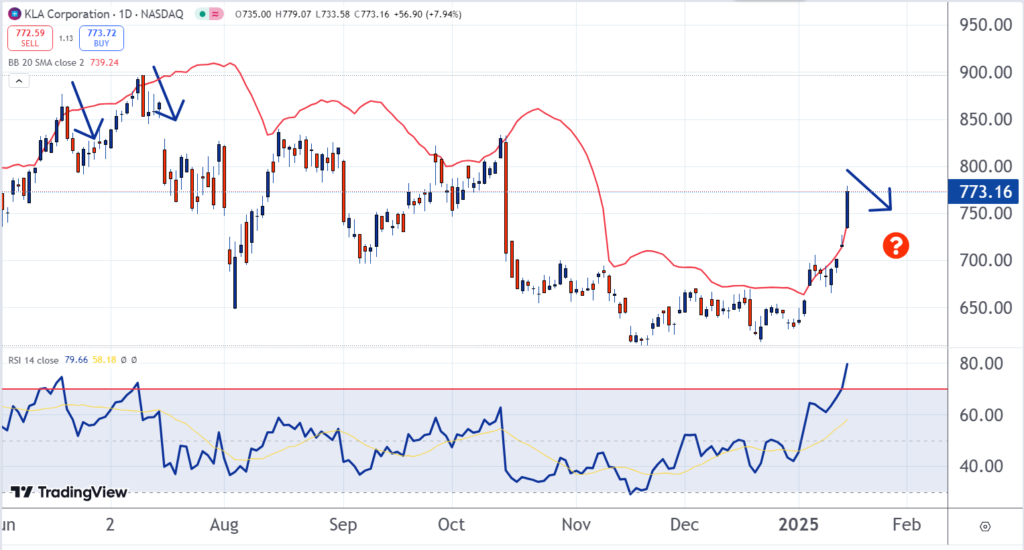
The lower part of the chart is the Relative Strength Momentum Indicator (RSI). This is a popular indicator. When the blue line is higher than the horizontal red line, it indicates overbought conditions. As you can see, that is the case now.
The red line on the price chart is called a Bollinger Band. It is another popular way to measure momentum.
The line is two standard deviations above the 20-day moving average. Statistics and probability theory suggest that 95% of trading should occur within two standard deviations of the mean.
If the stock exceeds this threshold, it is considered to be overbought. As you can see, that is the case now.
The last two times KLA Corporation was shown to be overbought simultaneously by both of these indicators, a sell-off followed soon after. It may be about to happen again.
Photo: JHVEPhoto via Shutterstock
Edge Rankings
Price Trend
© 2025 Benzinga.com. Benzinga does not provide investment advice. All rights reserved.
Trade confidently with insights and alerts from analyst ratings, free reports and breaking news that affects the stocks you care about.

