


Zinger Key Points
- Shares of Fair Isaac Corporation (FICO) are trading at a support level.
- Support levels can be created due to 'sellers remorse'.
- Pelosi’s latest AI pick skyrocketed 169% in just one month. Click here to discover the next stock our government trade tracker is spotlighting—before it takes off.
Shares of Fair Isaac Corporation FICO is trading a little lower Wednesday. This follows yesterday's announcement that the company will report its first quarter fiscal 2025 results on Feb. 4 after the market closes.
Certain charts can offer valuable lessons to traders. The chart of Fair Isaac is one of them. This is why our trading team has made it our Stock of the Day.
Some price levels are more important than others in the stock market. These are called support and resistance levels.
Support is a large concentration of traders and investors who are looking to buy shares at, or close to, the same price. Because of this large demand for a stock around these prices, market selloffs tend to end or pause when they reach support.
Resistance is the opposite.
It is a large group of investors and traders who are looking to sell shares at or close to the same price. Because of this large amount of supply, rallies tend to pause or end when they reach resistance.
Resistance and support levels form due to investment and trading psychology.
For example, resistance can form because of ‘buyer's remorse.' Sometimes, people regret buying shares if the price drops below the level they bought them for. Many of these remorseful buyers decide to sell if the price rallies back to their buy price so they can get out of their positions without losing money.
This price action can turn what had been a support level into a resistance level.
Support levels can form because of ‘seller's remorse'. This happens when people who sold shares at a support level regret doing so if the price moves higher.
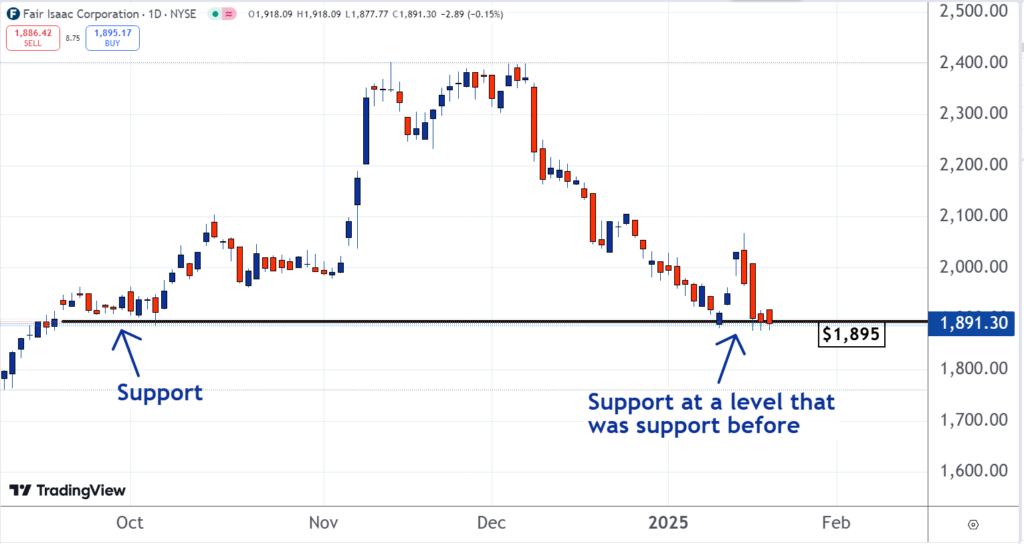
A number of these remorseful sellers vow to buy their shares back if they can get them for the same price they were sold for. So, if the stock eventually reverses and falls back to the support they place buy orders.
If there is a large number of these orders it will create support at the same price that had been support before. As you can see on the chart below, this is the case with the $1,895 level for Fair Issac.
Read Next:
Image: Shutterstock
Edge Rankings
Price Trend
© 2025 Benzinga.com. Benzinga does not provide investment advice. All rights reserved.
Trade confidently with insights and alerts from analyst ratings, free reports and breaking news that affects the stocks you care about.

