
Zinger Key Points
- Shares of Snap Inc (SNAP) have formed a series of 'lower highs'.
- This means there is a good chance that support breaks and the price falls.
- The new Benzinga Rankings show you exactly how stocks stack up—scoring them across five key factors that matter most to investors. Every day, one stock rises to the top. Which one is leading today?
Trading in Snap Inc. SNAP is quiet Tuesday. The shares have been holding above-important support around $10.40. But there is a good chance the support breaks and the price falls.
The company’s stock chart shows some characteristics of a classic ‘Head & Shoulders Pattern'. This is why our team of technical analysts has made Snap our Stock of the Day.
Many analysts don't understand the fundamentals and basics of technical analysis. They try to identify patterns on charts without understanding the price action that causes them to form.
It's rare to see a precise or ‘textbook' pattern on a chart. But that isn't important. What is, is that an analyst understands price action and psychology that is occurring.
A Head and Shoulders is a ‘reversal pattern'. This means at has to occur and the end of an uptrend. It shows the bears are taking the leadership from the bulls.
Read Also: Coca-Cola Pops In Q4—Revenue Soars 6%, CEO Hails ‘All-Weather Strategy’
One thing that happens when the bears are taking over is that ‘lower highs' form. Markets don't go in straight lines. They go in peaks and valleys. When a peak forms at a lower price level than the previous peak did, traders say it is a lower high.
This means that as time passes, sellers are willing to come into the market at lower levels. This is why the ‘right shoulder' forms at a lower price than the ‘head' does in a Head & Shoulders.
As you can see on the chart below, Snap’s last two peaks occurred at lower levels than the peak that would be considered the Head did in December. This shows that since then, people who want to sell are getting anxious and are willing to accept less for their shares.
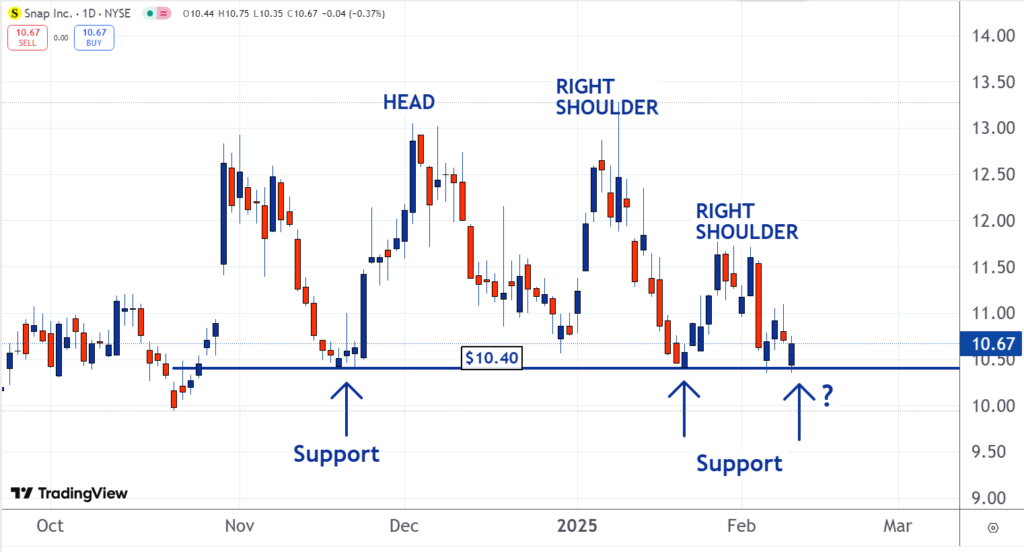
Now the stock is testing support around the $10.40 level. Because sellers have become increasingly aggressive while the buyers have been willing to be patient and hang out around the support level mean there is a good chance it breaks.
Aggressive sellers and patient buyers is typically bearish for a market.
Read Next:
Image: Shutterstock
Edge Rankings
Price Trend
© 2025 Benzinga.com. Benzinga does not provide investment advice. All rights reserved.
Trade confidently with insights and alerts from analyst ratings, free reports and breaking news that affects the stocks you care about.

