Zinger Key Points
- Both FANG and VNOM face bearish pressure, trading below key moving averages ahead of Q4 earnings.
- VNOM shows slight bullish support from the 200-day average, while FANG lacks similar technical backing.
- Markets are swinging wildly, but for Matt Maley, it's just another opportunity to trade. His clear, simple trade alerts have helped members lock in gains as high as 100% and 450%. Now, you can get his next trade signal—completely free.
Diamondback Energy Inc. FANG and Viper Energy Inc. VNOM are heading into fourth-quarter earnings under heavy bearish pressure, but their technical setups reveal contrasting signals for investors.
FANG Stock Stuck In Reverse
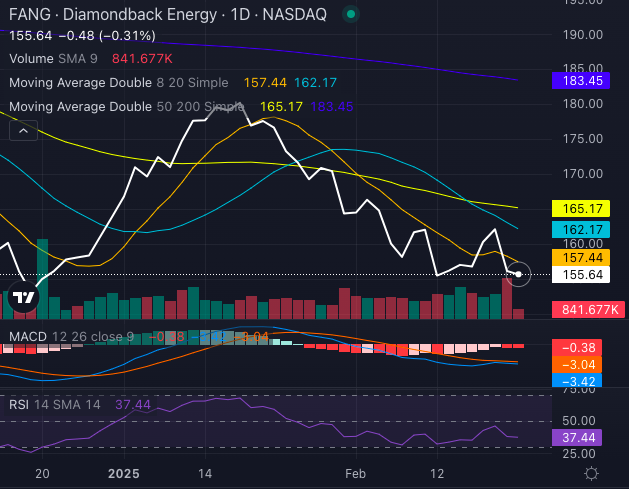
Diamondback Energy stock has slumped 12.09% over the past year and is down 6.65% year-to-date. The stock sits below its five-, 20- and 50-day exponential moving averages (EMAs), signaling a strongly bearish trend.

Chart created using Benzinga Pro
Diamondback Energy stock's eight-day simple moving average (SMA) of $157.44, 20-day SMA of $162.17 and 50-day SMA of $165.17 all flash bearish signals, as the stock trades beneath each level. Even the 200-day SMA of $183.45 reinforces this downside outlook.
The Moving Average Convergence Divergence (MACD) indicator sits at a negative 3.42, further supporting the bearish case. Meanwhile, the Relative Strength Index (RSI) at 37.44 suggests the stock is nearing oversold territory but not yet primed for a rebound.
Read Also: EQT, Viper Energy Shares Decline Amid Gas Price Volatility And Capital Discipline Focus
VNOM Stock: Bearish Short Term, Bullish Underneath
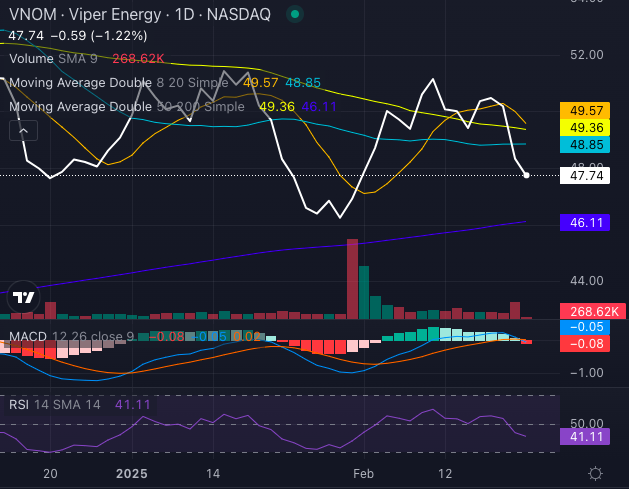
Viper Energy stock tells a slightly different story. While the stock is down 4.41% year to date, it’s still up 33.45% over the past year, reflecting stronger relative performance.

Chart created using Benzinga Pro
Viper Energy stock at $47.74 sits below its eight-day SMA of $49.57, 20-day SMA of $48.85 and 50-day SMA of $49.36 — all bearish signals similar to the stock’s signals.
However, Viper Energy's 200-day SMA of $46.11 offers a bullish signal, as the current price trades above this long-term support. The MACD indicator at a negative 0.05 further supports the short-term bearish signals, while the RSI at 41.11 and declining suggests the stock is approaching oversold conditions without being extreme.
Investor Takeaway
Both Diamondback Energy and Viper Energy face short-term bearish pressure, but Viper Energy's strength above its 200-day SMA and positive MACD hint at a potential rebound. Diamondback Energy, on the other hand, lacks similar support and remains firmly in bearish territory.
As earnings approach, investors may find Viper Energy the comparatively stronger play — unless Diamondback Energy delivers an earnings surprise that flips the script.
Read Next:
Photo: Shutterstock
Edge Rankings
Price Trend
© 2025 Benzinga.com. Benzinga does not provide investment advice. All rights reserved.
Trade confidently with insights and alerts from analyst ratings, free reports and breaking news that affects the stocks you care about.