
Zinger Key Points
- Shares of Dollar Treet appear to have formed an 'ascending triangle pattern'
- This pattern has bullish implications and suggest that the stock will move higher.
- Our government trade tracker caught Pelosi’s 169% AI winner. Discover how to track all 535 Congress member stock trades today.
Shares of Dollar Tree, Inc. DLTR are trading flat Tuesday. But there is a good chance they will soon breakout and move higher.
The stock appears to have formed a classic ‘ascending triangle pattern,' which tend to be bullish. This is why our team of technical analysts has made it Benzinga’s Stock of the Day.
Technical analysis has a dubious reputation and it's easy to understand why. Many technical analysts don't understand the fundamentals of the analysis. They try to identify patterns on charts without understanding the price action that causes them to form.
If the bulls are taking over from the bears or the bears are taking over from the bulls, the price action could result in creating a ‘reversal pattern' on a chart.
Read Also: Putin Offers Russian Aluminum, Rare Earths As An Alternative To Ukraine’s Minerals
If the change in leadership takes place over an extended period of time, a ‘rounded top' or ‘rounded bottom' may form. If the change takes place in one day, a ‘reversal day' pattern can appear.
If a stock is trending in one direction and then takes some time consolidating before continuing the trend, it could appear as a ‘continuation' pattern. If it’s an uptrend, it could appear as an ‘ascending triangle pattern'.
As you can see, one of these has formed on Dollar Tree’s chart.
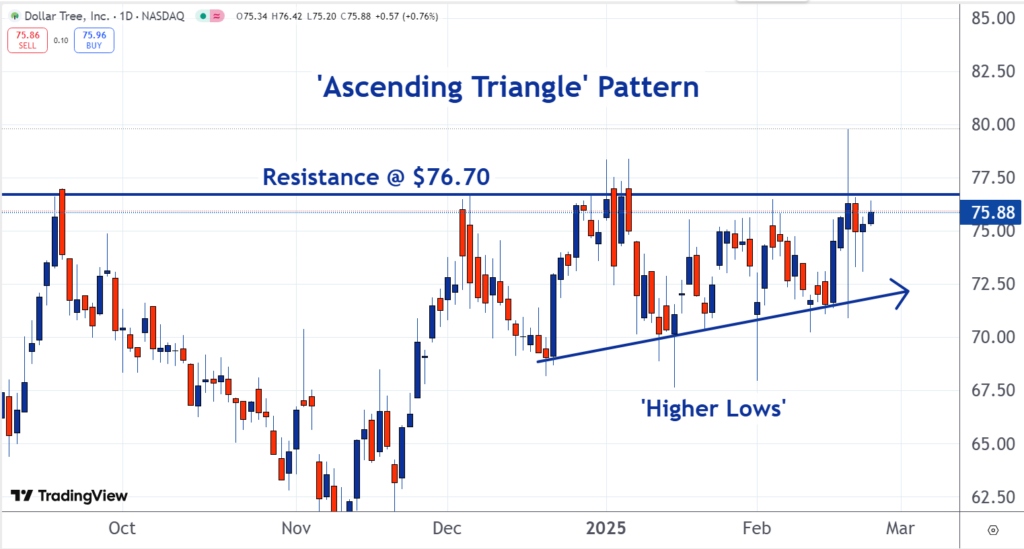
This pattern shows that the sellers are patient. They are willing to hang out around the $76.60 resistance level. If the buyers come to them, they will sell, but if not, they’ll wait.
The pattern also shows that as time has passed, buyers have become increasingly aggressive. They have been willing to pay higher prices.
This action is illustrated by the ascending line in the pattern. Markets don't go in straight lines, but rather in peaks and valleys. If a valley forms at a higher price than the valley that came before it, traders say it is a ‘higher low'. This shows that buyers are entering the market at higher prices.
The ascending triangle pattern is an illustration of aggressive buyers and patient sellers. These dynamics tend to be bullish and suggest that Dollar Tree will keep moving higher.
Photo: Shutterstock
© 2025 Benzinga.com. Benzinga does not provide investment advice. All rights reserved.
Trade confidently with insights and alerts from analyst ratings, free reports and breaking news that affects the stocks you care about.

