


Zinger Key Points
- Vistra stock is in a strongly bearish trend, trading below key moving averages ahead of Q4 earnings.
- RSI nearing oversold levels—investors watching for a potential bounce if selling pressure intensifies.
- Feel unsure about the market’s next move? Copy trade alerts from Matt Maley—a Wall Street veteran who consistently finds profits in volatile markets. Claim your 7-day free trial now.
Vistra Corp VST will be reporting its fourth-quarter earnings on Thursday. Wall Street expects $1.52 in EPS and $3.79 billion in revenues as the company reports before market hours.
The stock is up 203.61% over the past year, down 1.1% year-to-date.
Let’s look at what the charts indicate for Vistra stock and how the stock currently maps against Wall Street estimates.
Read Also: Here’s How Much You Would Have Made Owning Vistra Stock In The Last 5 Years
VST Stock Strongly Bearish Ahead Of Q4 Earnings
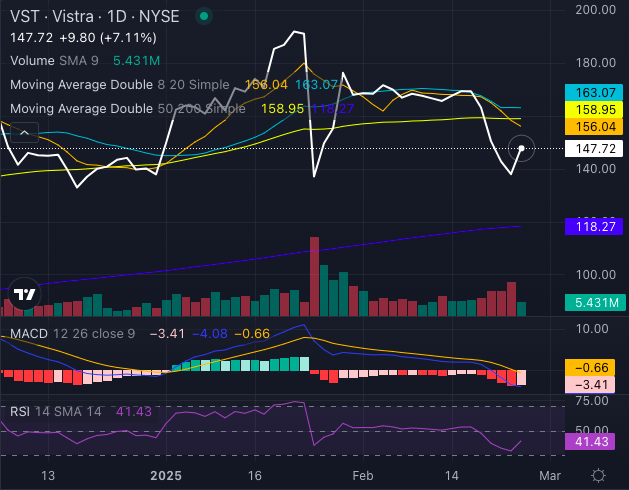
Chart created using Benzinga Pro
Vistra stock, at $146.72, is currently in a strongly bearish trend. The stock is trading below its five-day, 20-day and 50-day exponential moving averages (EMA).
This signals continued downside pressure. The stock is also experiencing buying interest, which could pave the way for a bullish reversal if momentum strengthens.
The eight-day simple moving average (SMA) at $156.04, 20-day SMA at $163.07 and the 50-day SMA at $158.95 all indicate a bearish setup, suggesting resistance in the near term.
On the other hand, VST stock remains above its 200-day SMA of $118.27, offering a long-term bullish signal.
Momentum indicators further confirm short-term weakness. The Moving Average Convergence Divergence (MACD) is at a negative 4.08, indicating bearish momentum.
Meanwhile, the Relative Strength Index (RSI) at 41.43 suggests the stock is approaching oversold conditions. If RSI moves below 30, a potential rebound could materialize, making VST a stock to watch for investors looking for an entry point.
Vistra Analysts Consensus Ratings
Ratings & Consensus Estimates: The consensus analyst rating on Vistra stock stands at a Buy currently with a price target of $104.80.
VST Price Action: Vistra stock was trading at $148.09 at the time of publication.
Read Next:
Image: Courtesy of Vistra
Edge Rankings
Price Trend
© 2025 Benzinga.com. Benzinga does not provide investment advice. All rights reserved.
Trade confidently with insights and alerts from analyst ratings, free reports and breaking news that affects the stocks you care about.

