
Zinger Key Points
- Nike stock is in a strong bearish trend, trading below all key moving averages with heavy selling pressure.
- Weak fundamentals and technicals weigh on Nike, though oversold RSI hints at a potential short-term bounce.
- Feel unsure about the market’s next move? Copy trade alerts from Matt Maley—a Wall Street veteran who consistently finds profits in volatile markets. Claim your 7-day free trial now.
Nike Inc. NKE is limping, not sprinting, to new lows. Down 30.16% in the past year and 17.85% in just the last month, the sneaker giant finds itself at the bottom of its 52-week range at $64.95.
With technical indicators flashing red, is there any sign of a turnaround, or is this stock set to stay in the bargain bin?
Read Also: Wall Street’s High Rollers: Berkshire Hathaway, RTX, Kinross Gold Hit 52-Week Peaks
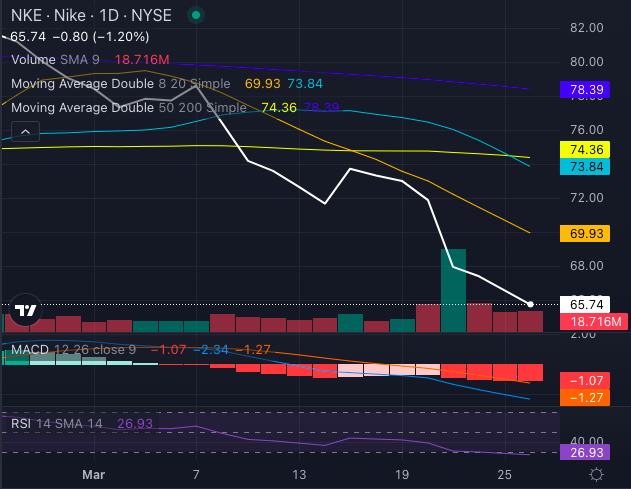
Chart created using Benzinga Pro
Nike Stock Stuck In A Bearish Downtrend
Nike stock, at $65.74 is stuck below every key moving average:
- Eight-day simple moving average (SMA): $69.93 (Bearish)
- 20-day SMA: $73.84 (Bearish)
- 50-day SMA: 74.36 (Bearish)
- 200-day SMA: 78.39 (Bearish)
The Moving Average Convergence Divergence (MACD) indicator sits at -2.34, further reinforcing the bearish momentum. Meanwhile, the Relative Strength Index (RSI) has dropped to 26.93, indicating that Nike stock is deep in oversold territory—potentially ripe for a short-term bounce, but still struggling overall.
Selling Pressure & A Slowing Business
The downtrend isn't just a technical issue – Nike's fundamentals aren't helping either. The company recently warned of a double-digit sales decline in its fourth fiscal quarter due to tariffs, weak consumer confidence, and a sluggish turnaround strategy.
During the critical holiday quarter, sales fell 9%, largely due to weak demand in China.
Adding to the pressure, Nike is still working through excess inventory and outdated styles, forcing markdowns that are weighing on margins. The company expects its gross margin to shrink by as much as five percentage points in the current quarter as it clears the backlog.
The Verdict: Oversold, But Not A Slam Dunk
Nike's stock is clearly in a bearish trend, weighed down by weak fundamentals and deteriorating technicals. While its RSI suggests oversold conditions that could spark a short-lived bounce, the broader downtrend remains intact.
Until the company finds its footing with stronger sales and improved margins, investors may want to lace up their running shoes and wait for a clearer buying opportunity.
Read Next:
Photo: Shutterstock
Edge Rankings
Price Trend
© 2025 Benzinga.com. Benzinga does not provide investment advice. All rights reserved.
Trade confidently with insights and alerts from analyst ratings, free reports and breaking news that affects the stocks you care about.

