Daily Bars
Prepared by Jamie Saettele, CMT
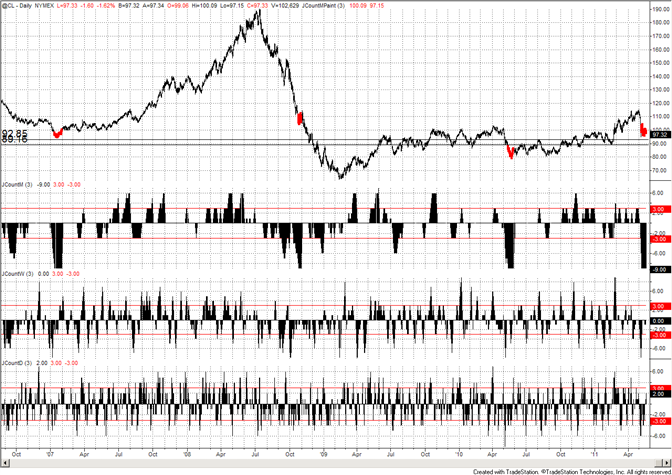
Near term, crude weakness (from 104.60) may also be a B wave. Like gold, the implications are for a test of the high (104.60) before weakness resumes. Resistance comes in at 106.05 (former support) and 107.11 (61.8% retracement). The colored bars above indicate instances when the monthly support/resistance indicator is at -9. The level indicates an important moment in time in which price will either reverse sharply or continue lower. Having already broken the pivot low at 98.02, a bearish resolution seems more likely (there does remain potential for continued corrective strength however).
Support/Resistance Index (M,W,D) – (9), 0, 3
Jamie Saettele publishes Daily Technicals every weekday morning, COT analysis (published Monday), technical analysis of currency crosseson Wednesday and Friday (Euro and Yen crosses), and intraday trading strategy as market action dictates at the DailyFX Forex Stream. A graduate of Bucknell University, he holds the Chartered Market Technician (CMT) designation from the Market Technician Association. He is the author of Sentiment in the Forex Market. Send requests to receive his reports via email to jsaettele@dailyfx.com.
© 2024 Benzinga.com. Benzinga does not provide investment advice. All rights reserved.
Comments
Trade confidently with insights and alerts from analyst ratings, free reports and breaking news that affects the stocks you care about.

