

Shares of United Continental holdings Inc UAL look like they're primed for a breakout.
The stock, which has struggled to regain losses from the February sell-off, is right up against the $73 handle, which has acted as resistance. The chart below from VantagePoint Software shows how the recent uptrend is expected to continue.

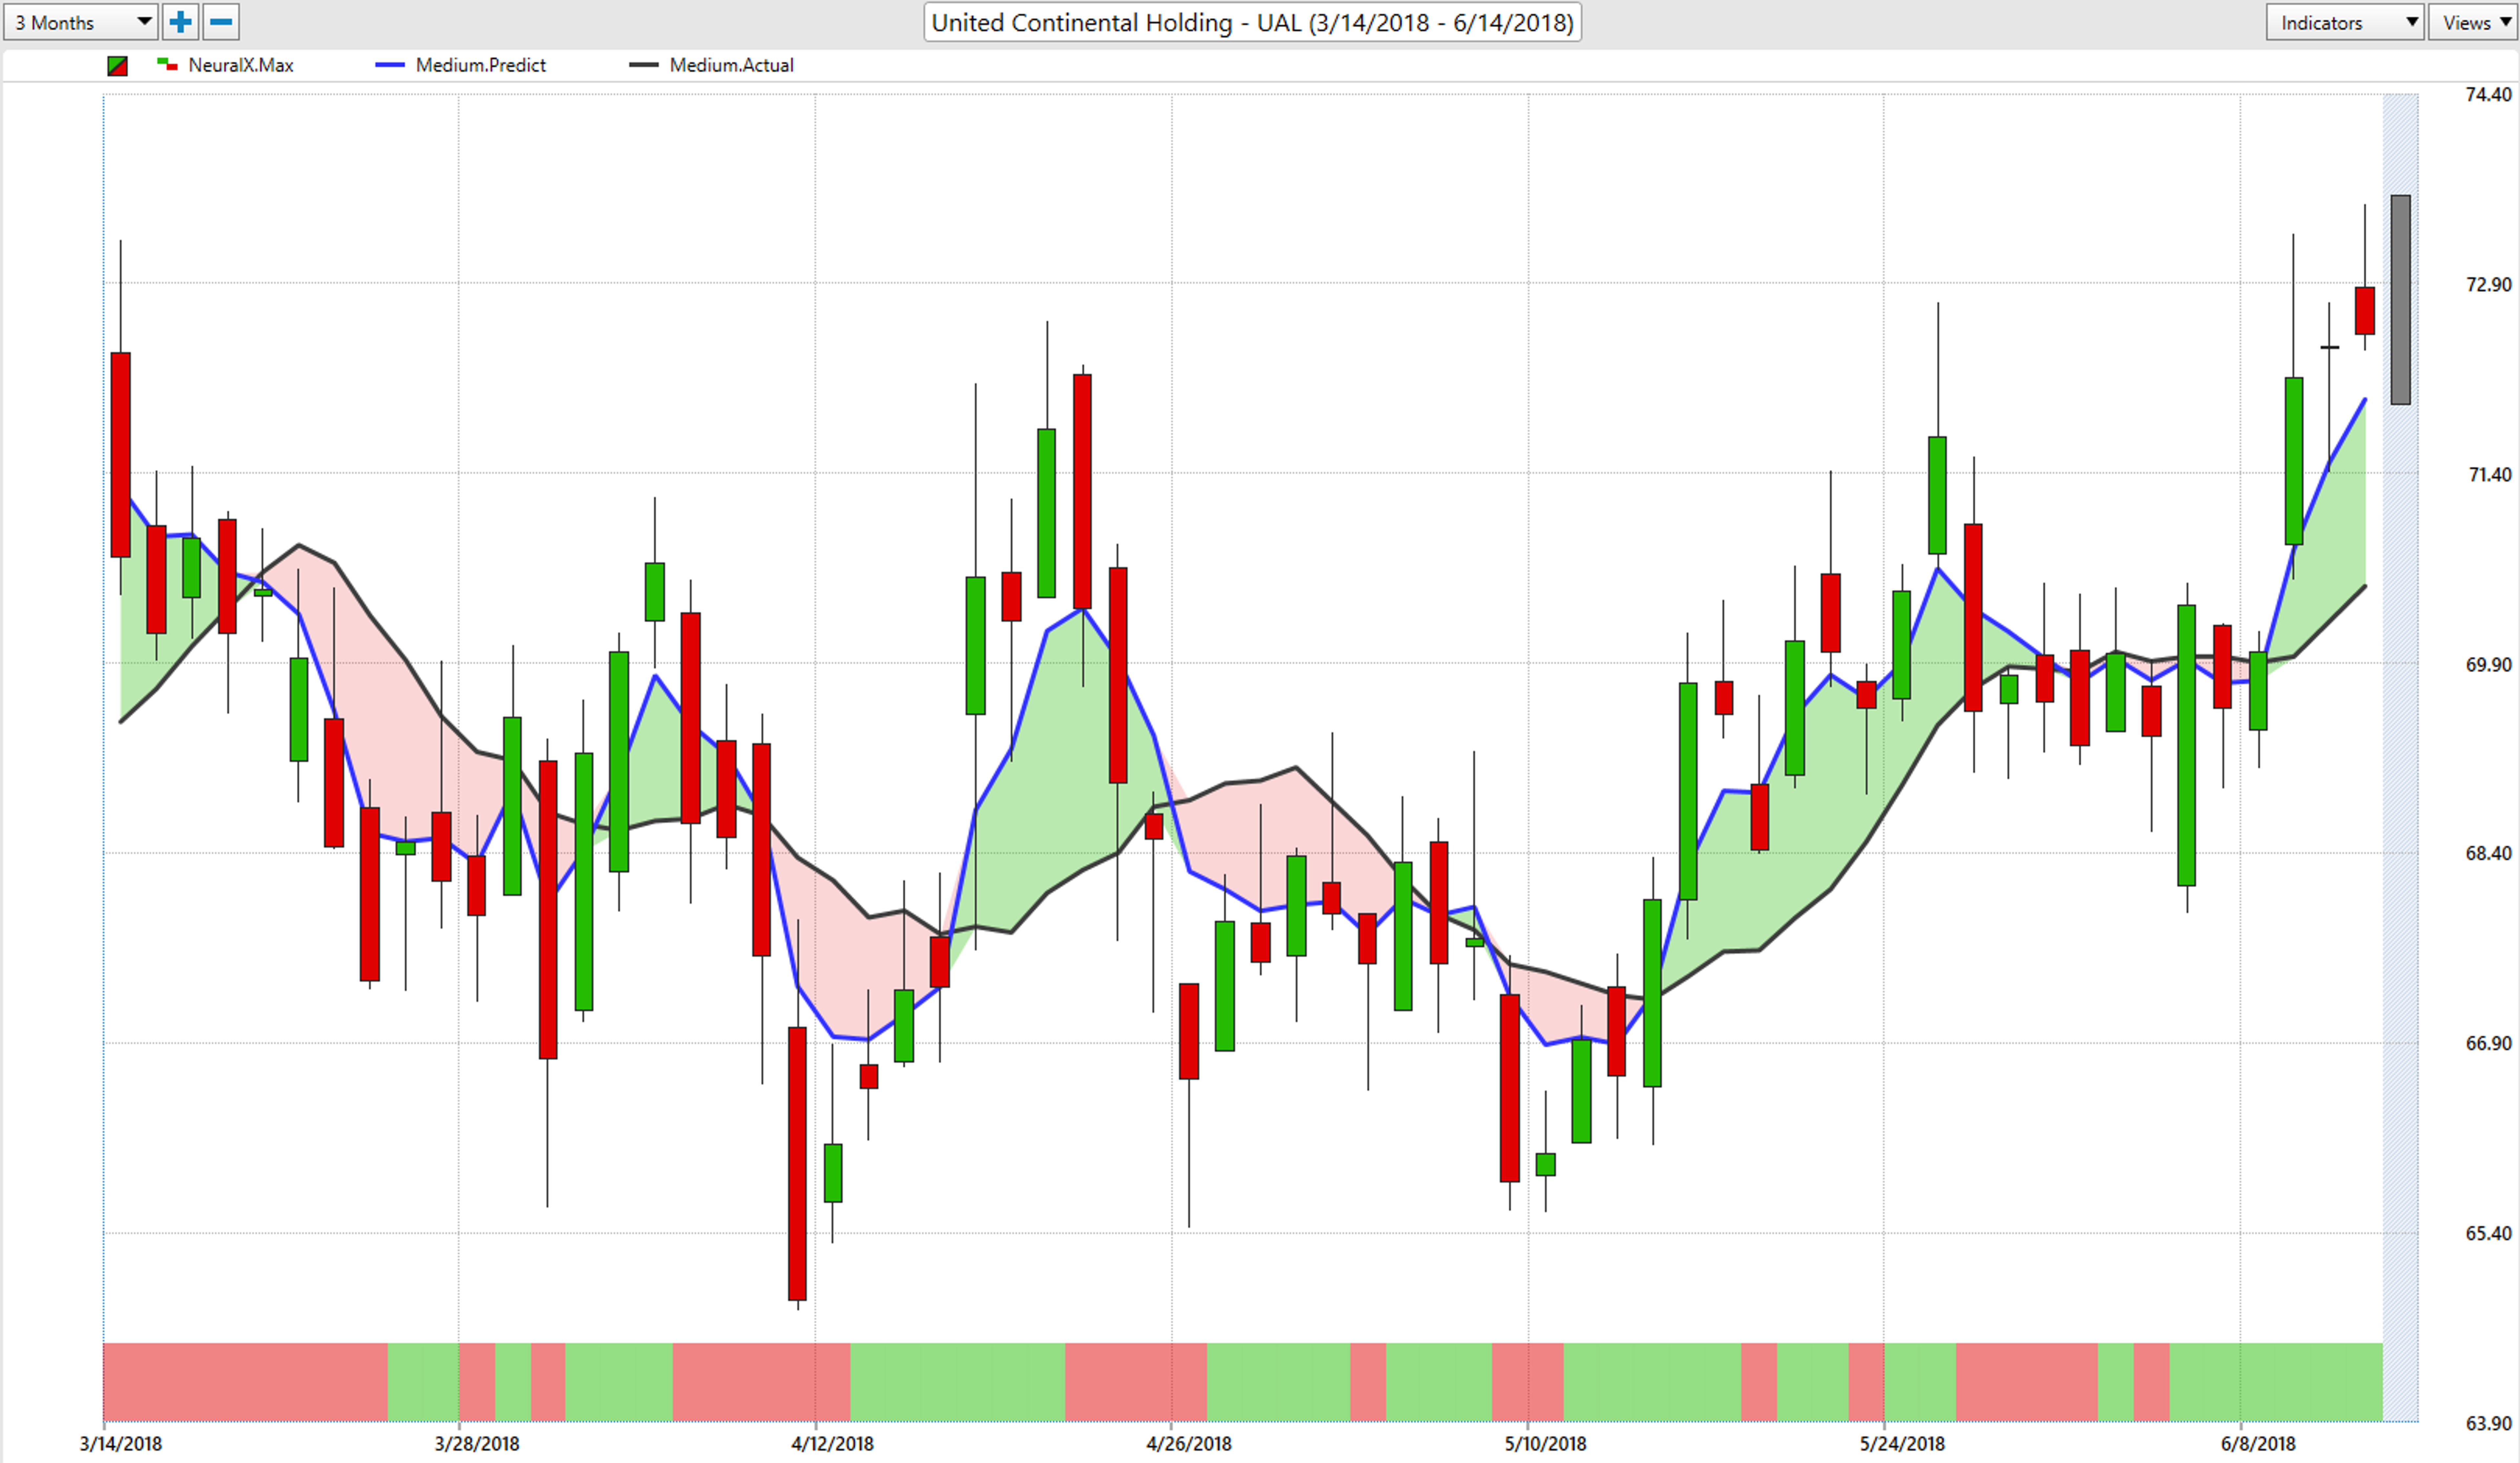
First, we'll point out that the blue line, a 48-hour predicted moving average, recently crossed above the black line, a 10-day moving average, on June 8. This crossover indicates upside, as it's showing that the predicted price for the next two trading days is higher than the current price.
As the gap between the two lines has widened, we can also see the Neural Index bar at the bottom of the chart has turned green. This forecasts strength or weakness over the following 48-hour period, thereby confirming what the moving averages are forecasting.
The breakout may have been fundamentally driven, as United recently reported that trans-Atlantic traffic in May increased 13.4 percent year-over-year, and overall traffic was up 6.7 percent. Buckingham research also raised their price target from $88 to $96.
Shares of UAL were trading flat as of this writing on Thursday.
Vantagepoint is a content partner of Benzinga.
Edge Rankings
Price Trend
© 2025 Benzinga.com. Benzinga does not provide investment advice. All rights reserved.
Trade confidently with insights and alerts from analyst ratings, free reports and breaking news that affects the stocks you care about.

