The following stock has been highlighted by VantagePoint Software, an artificial intelligence platform that provides market forecasts 1-3 days in advance.
The final two weeks of June saw shares of NVIDIA Corporation NVDA slide 11 percent, as the stock gave back most of its gains from the beginning of May. But the stock looks to have made a turnaround according to VantagePoint Software.
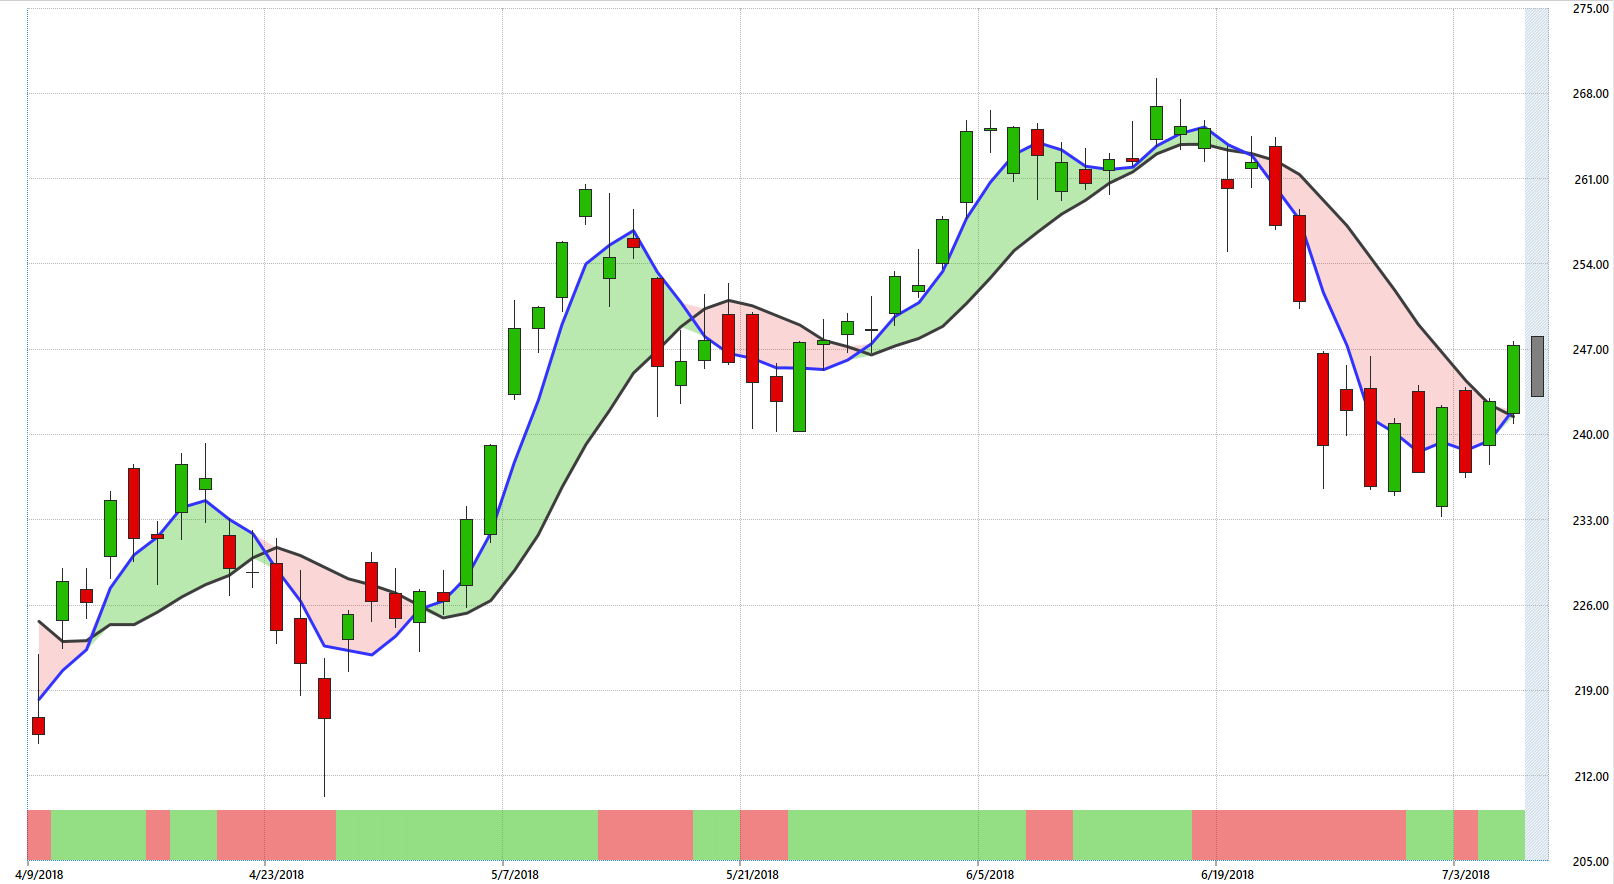
In July's six trading days NVDA has risen over 6 percent, completely filling the gap down from June 22-25. The chart below shows this trend change in action. The black line shows the stock's current 10-day moving average. The blue line shows a predicted moving average 48 hours in advance. When the blue line crosses over the black line, that indicates a bullish trend, and a bearish trend is signaled by the black line crossing over the blue.
You can see how the recent price action has led to a change in trend and crossover of the blue line over the black. This tells us that the stock is likely headed for more upside this week.
As a confirmation, we can look to the bottom of the chart where the Neural Index, which forecats whether the price of a stock will be higher or lower in the coming 48 hours. The shift to green tells us that yes, the price of NVDA will likely be higher 48 hours from now.
In terms of technical levels, the next significant price on the upside is at $269.20, which is the all-time high from June 14. On the downside, $233.26 is the low of the recent move, so that will provide some support.
VantagePoint Software is a content partner of Benzinga. For a free demo click here.

© 2025 Benzinga.com. Benzinga does not provide investment advice. All rights reserved.
Trade confidently with insights and alerts from analyst ratings, free reports and breaking news that affects the stocks you care about.