2018 is set to go down on Wall Street as the worst year for equities since the 2008 crash, with its final month trending toward the worst December since the Great Depression. As the major indexes continue their approach to bear market territory, equity traders might be wondering where 2018’s silver lining might be hiding, if it’s there at all.
Below, we will take a brief survey of the broad market before breaking down some of the strongest trends lurking just beneath the ugly surface.
First, regarding that ugly surface, you can see just how bad December’s been with this two-week performance window on the S&P 500 stocks, while the bottom chart reflects each stock’s market cap.
Of the 505 stocks included in the index, only about 2 percent of the index traded in the green from early December to Christmas. Alternatively, more than 75 percent of those securities have fallen by 4 percent or more, and roughly 20 percent are officially in corrections over that span alone
With these stats, we can start scrolling through some of Finscreener’s preset screening criteria to understand how that ratio holds up among various popular stock opportunities.
First, let’s look at undervalued growth stocks, which includes companies with a PE ratio below 17, a PEG ratio less than 1 and expected EPS growth of at least 25% over the next 5 years. We’ll also alter the histogram’s bottom portion to show each stock’s forward PE ratio, to provide a better sense of each stock’s value going into the coming earnings season.
Valero and Diamondback are close runner’s up, each with forward PE ratios below 10. Valero Reports the final day of January while FANG releases its figures February 12.
However, each of those stocks is still deeply in the red over the recent sell-off. For a more varied chart, let’s pull up stocks with a high dividend yield, those above 3 percent. However, we’ll also add the stipulation that the stocks should also have a price to cash flow ratio above 14 and be in the green over the past 3 months.
The chart’s makeup is somewhat more attractive than the entirety of the S&P over the past two weeks. About half of the stocks shown above have posted only modest losses, while the other half is still in the deep red.
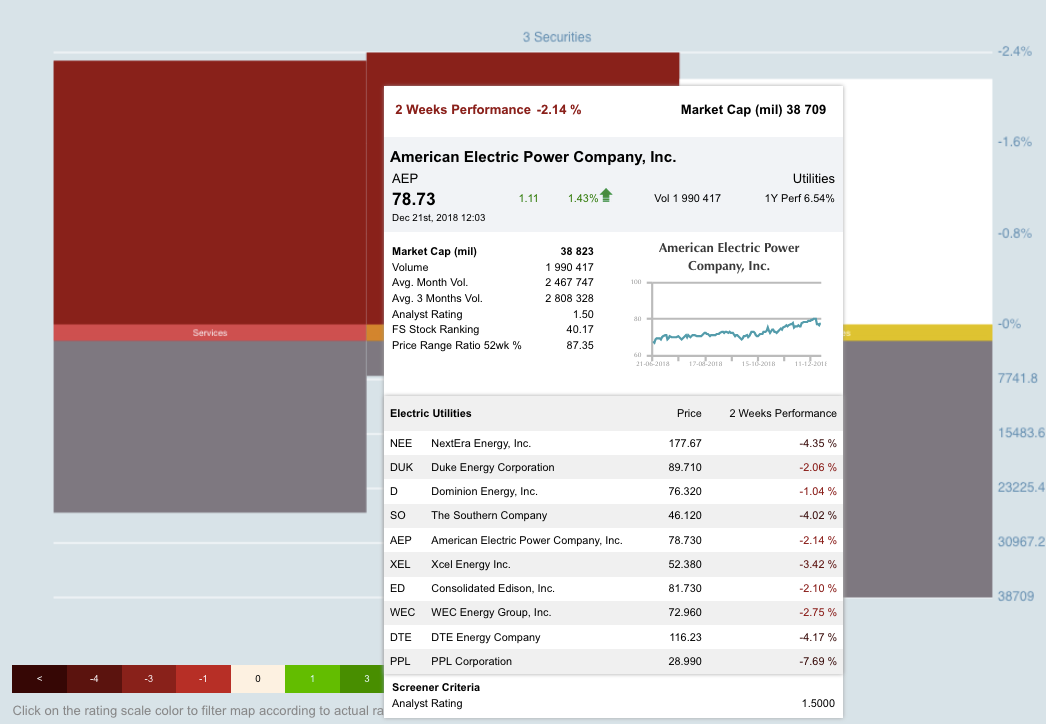
The green bar on the far left, belonging to CenterPoint Energy Inc. (NYSE:CNP) certainly stands out. But we can get a different perspective by grouping them by sector, which reveals that, in addition to CenterPoint, utility stocks in general have dominated over the quarter, which might make that high dividend even more attractive to traders.
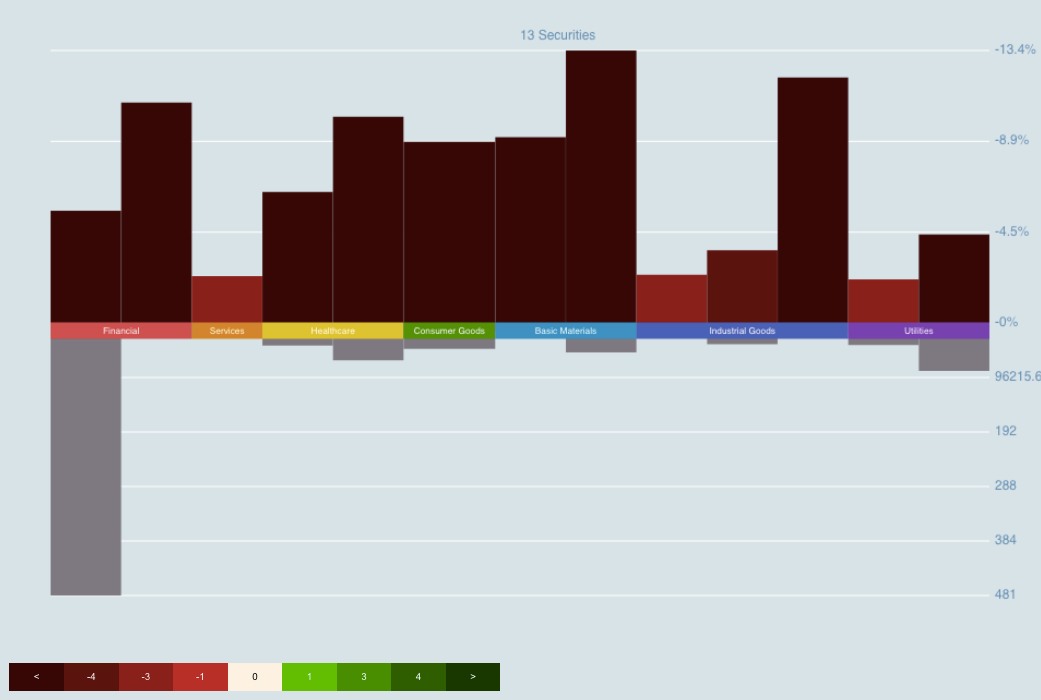
Finally, let’s see how analyst opinions have fared in the 2018 carnage by filtering for stocks with a “strong buy” rating from analysts. We’ll keep the groupings for convenience and also set the bottom of the histogram to reflect each stock’s market cap.
Hopefully this demonstration has helped alleviate some of the anxiety piling up in the current bear’s den. While these searches just provide a few examples of potential stock market bright spots, cunning traders know that there’s always opportunity to profit when there’s blood on the street.
Finscreener is a content partner of Benzinga.
© 2026 Benzinga.com. Benzinga does not provide investment advice. All rights reserved.
To add Benzinga News as your preferred source on Google, click here.