
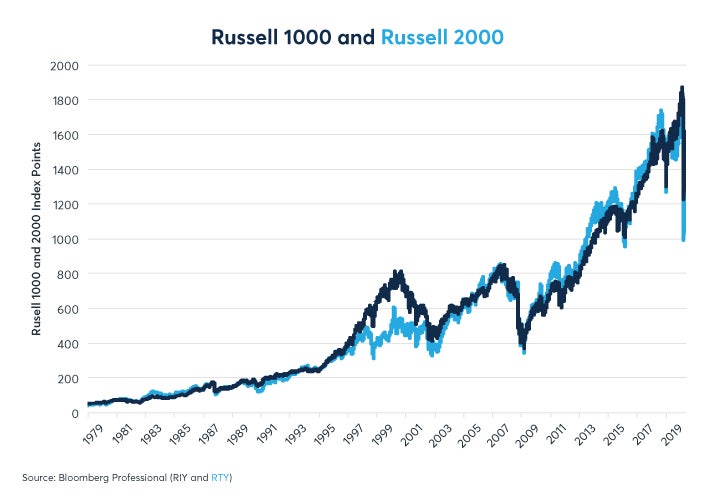
Since its debut in 1979, the Russell 2000 index of small-cap companies has broadly kept pace with both the Russell 1000 and S&P 500 indices of larger and mid-cap stocks (Figures 1 and 2). However, while small and large-cap companies have delivered similar overall performances over the past four decades, there have been periods of significant variations, including in the first four months of 2020 when small-caps stocks underperformed large-cap companies by nearly 15%.
Figure 1: The S&P 500® and Russell 2000 have delivered similar performances since 1979
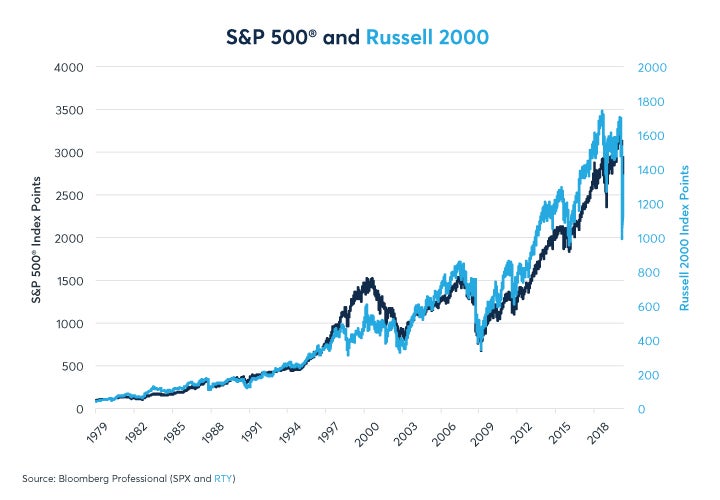
Figure 2: Russell 1000 and Russell 2000 have had similar overall performances over 41 years
Prior to 2020, small-cap stocks often outperformed during periods of economic distress (Figure 3):
- 1979-82: During a period of high inflation, significant swings in interest rates and a double-dip recession that took unemployment from 5.5% to 10.8%, the Russell 2000 fared better than the S&P 500 by 76%.
- 1990-93: Russell 2000 did better than S&P 500 by 48% during a period of economic recession and subsequent slow recovery associated with the Savings & Loan crisis and the Persian Gulf War
- 1999-2013: Russell 2000 rose by 114% with respect to S&P 500 during a period that featured the ‘tech wreck’ recession of 2001, 9/11, two wars, the global financial crisis and a rather slow economic recovery. There were periodic interruptions in small-cap stocks’ strong performance, especially from 2005 to 2007 when the 2003-07 economic expansion reached it peak.
To learn more about futures and options, go to Benzinga’s futures and options education resource.
© 2025 Benzinga.com. Benzinga does not provide investment advice. All rights reserved.