
Investors Going Bullish on TAN
The Invesco Solar ETF TAN has been on a steep rise on the heels of bullish investor sentiment. A major push to more clean energy sources is a top priority in the United States. TAN has climbed +226% in one year and has outperformed the market in an intermediate and short term basis.
Relative Outperformance
As you can see from the table below, TAN has outperformed SPY in the 1 year, 6 months, 3 months, and 2 week periods. That can be a strong indicator that investors are bullish on solar energy.
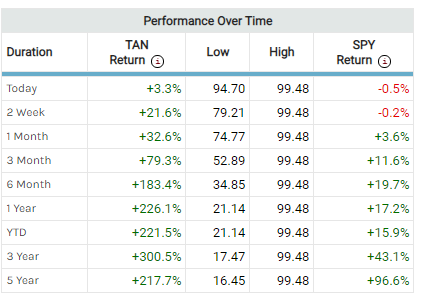
Source: MarketChameleon
Option Order Flow Sentiment
Also, option order flow sentiment has been steadily bullish. The table below shows that bullish call buying on average tops bearish put buying by more than a 4 to 1 ratio ($643K in bullish call buying vs $142K in bearish put buying). The most recent 5 days shows you that, on average, bullish call buying has been getting more aggressive relative to its 30-day average. On average, traders have bought $1.5 million of bullish calls in the last 5 days compared to $643K over the last 30 days.
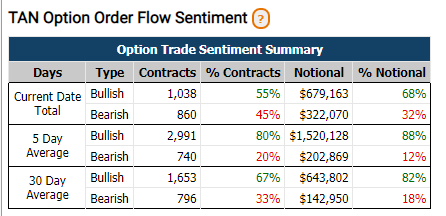
Source: MarketChameleon
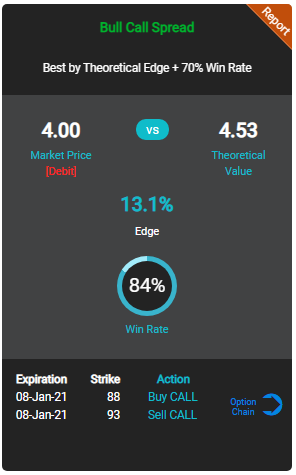
Bullish Option Call Spread
One way to play a short term bullish trend is a bullish call spread, which provides limited risk and excellent returns for short term outlooks. The following trade idea was scanned for the best theoretical edge with a high historical probability of success. The call spread involves buying a 08-Jan-21 call 88 strike and selling a 08-Jan-21 call 93 strike for $4. When applying historical data to a spread with similar conditions, the theoretical value of the spread is $4.53, which gives this spread a theoretical edge of 13.1%. Additionally, based on historical stock moves, the spread has an 84% probability of success. If TAN continues to rise, as the bullish stock indicators seem to suggest, and closes above $93, then the return on this call spread will be 25% ($5 - $4 cost = $1 profit. $1 profit / $4 cost = 25%). Note that TAN is already above $93 at the time of this writing.
Payout Diagram for Option Spread
The payout diagram below shows you that the maximum gain is $1 and that is made when the TAN is at or above $93. Also, the breakeven point will be reached at $92 and the maximum loss is the amount you paid for the spread, which is $4 as of the time of this writing.
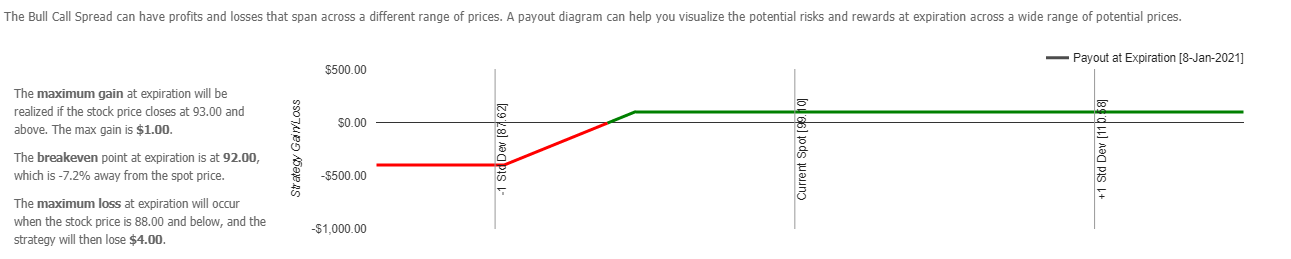
Source: MarketChameleon
Main Takeaway
A more aggressive approach toward clean energy can greatly benefit the solar industry. A bull call spread can give you solid returns if a bullish (or even a somewhat muted) trend continues. Furthermore, because the call spread is a predefined strategy, you will have limited and measurable risk.
© 2025 Benzinga.com. Benzinga does not provide investment advice. All rights reserved.
Trade confidently with insights and alerts from analyst ratings, free reports and breaking news that affects the stocks you care about.

