Savara Inc. SVRA shares rallied Tuesday after Piper Sandler initiated coverage of the stock with an Overweight rating and $7 price target.

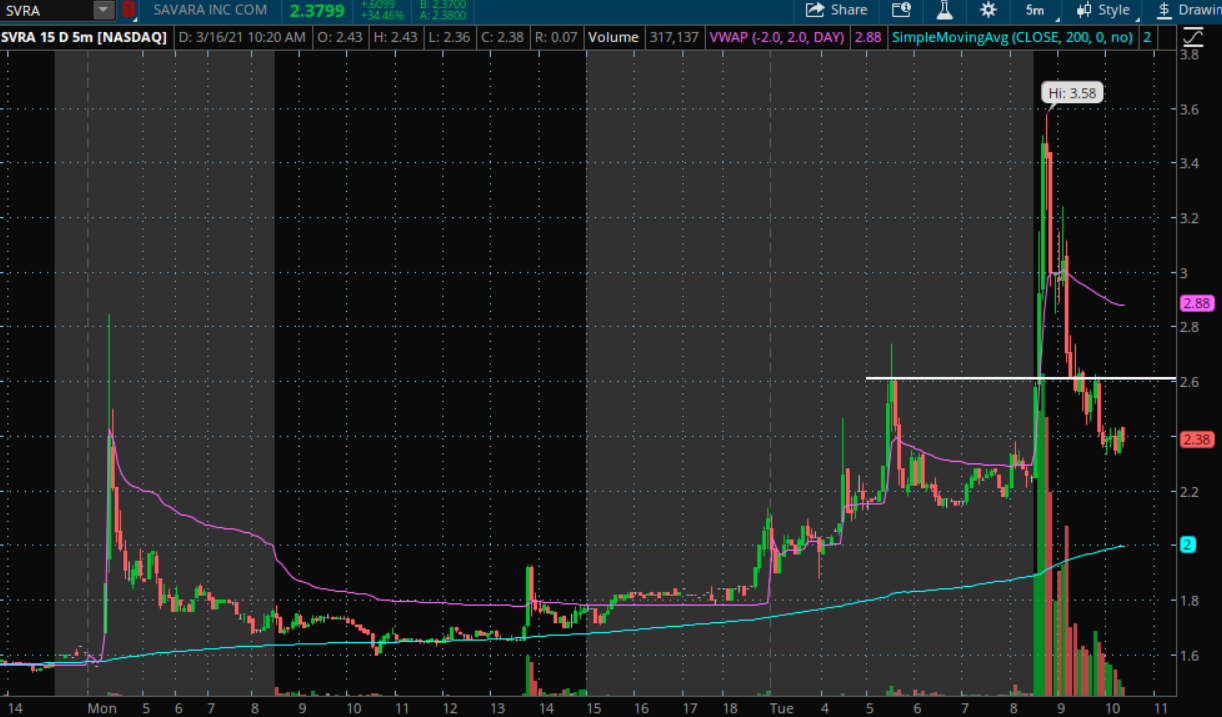
The Short-Term Savara Chart: The 5-minute chart above shows the stock rallied following the market open and has since made a correction. Key short-term indicators to watch are the volume-weighted average price (pink) and the 200-day moving average (blue).
The stock trading above the 200-day moving average brings a bullish sentiment to the stock.
The stock being below the VWAP shows it can move back near the indicator before it may hold as resistance if traders decide to sell at the VWAP price. The VWAP may hold as a short-term resistance level, and the 200-day moving average may hold as a short-term support level for the stock. Other key levels may be found near $2.60, as this was a previous resistance that tried to hold as a support level.

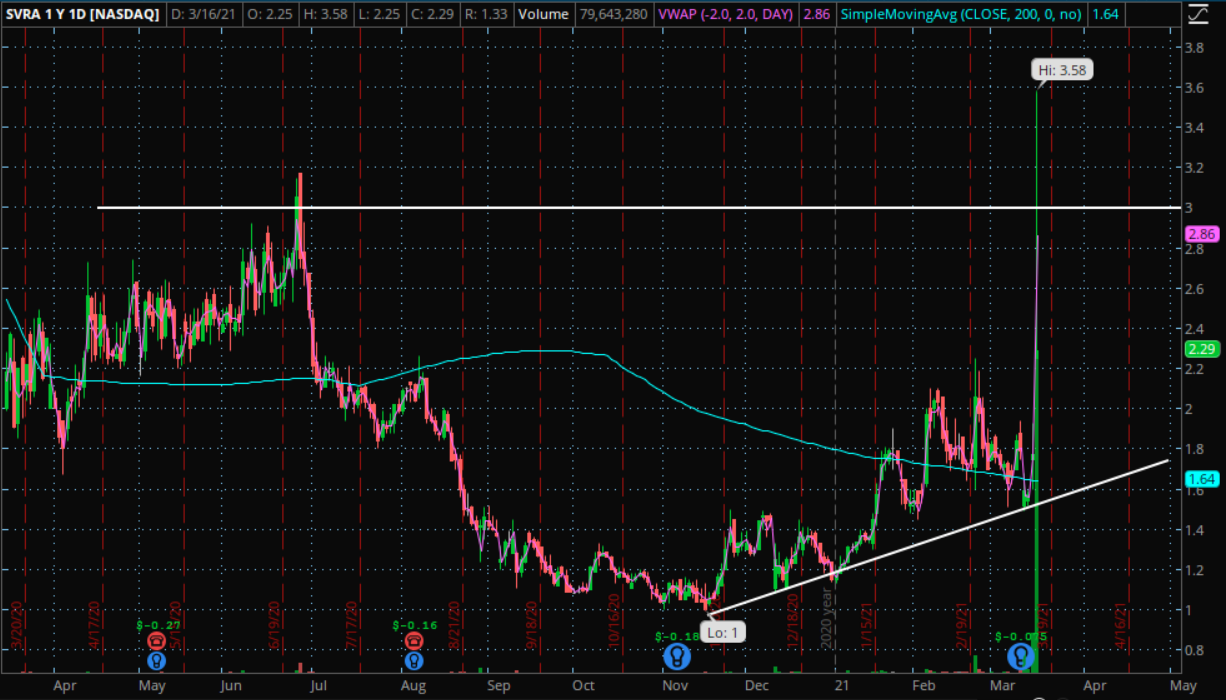
Savara Daily Chart Analysis: The daily chart above shows the stock previously struggled to get above $3.
A close above this level is what bullish technical traders would like to see out of the stock for possible moves higher.
In the long-term, the chart looks to be forming what technical traders may call an ascending triangle, where higher lows are building and being condensed into a price level before the price may finally break away from the level.
The higher lows are building near the 200-day moving average, potentially adding more support at these levels.
Bulls would like to see the stock climb to the price level before breaking out and consolidating for possible further moves. Bears would like to see the price stop forming higher lows and start falling.
SVRA Price Action: The stock is trading with a market cap of $95 million and a public float of 45 million shares. The stock was up 41.81% at $2.51 at last check.
Edge Rankings
Price Trend
© 2025 Benzinga.com. Benzinga does not provide investment advice. All rights reserved.
Trade confidently with insights and alerts from analyst ratings, free reports and breaking news that affects the stocks you care about.