
SOS Limited SOS shares have traded with increased volume throughout the past three months. The stock was trending Thursday although there was no company-specific news to explain the trending status.
Below is a technical analysis of the chart.
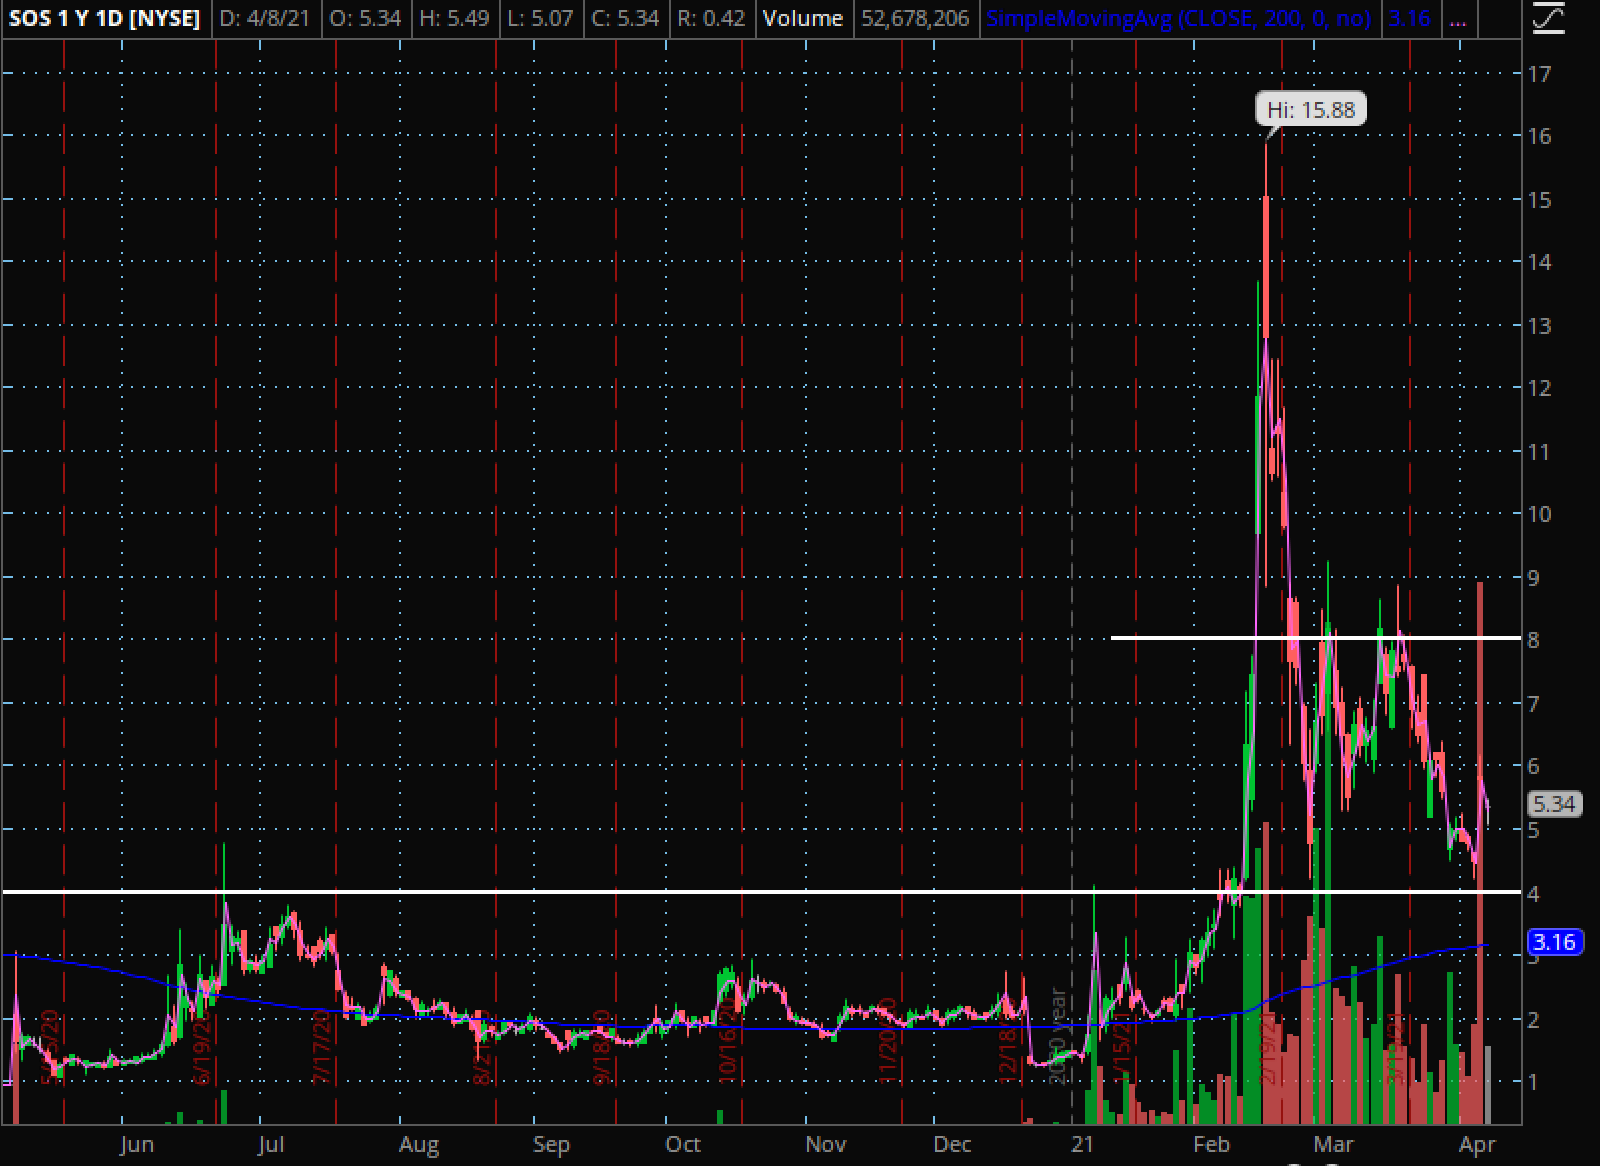
SOS Daily Chart Analysis: The chart shows that the stock has been trading within a channel throughout the year, and on increased volume during the past few months.
The stock was previously unable to break above the $4 level. This area held as resistance before the stock was able to break above and retest the area as support. The $4 level now is holding as support at the bottom of the channel.
The stock later showed resistance near the $8 level. The $8 area was a place on the chart where the stock struggled to cross above. This area may act as resistance again in the future on the chart.
The stock is trading above the 200-day moving average (blue), indicating the sentiment in the stock is most likely bullish. This indicator may hold as an area of support at some point in the future.
What’s Next For SOS? Bullish technical traders would like to see the stock build higher lows up to the resistance level before breaking out above. If the stock is able to consolidate above the $8 level for a time, it may see a higher bullish push.
Bearish traders would like to see the stock start to fall towards support. Bears would like to see the stock fail to hold the support and fall below. With consolidation below the support level, the stock may be able to see a lower move.
© 2025 Benzinga.com. Benzinga does not provide investment advice. All rights reserved.
Trade confidently with insights and alerts from analyst ratings, free reports and breaking news that affects the stocks you care about.

