Ammo Inc. POWW shares were trading higher Friday as retail traders pushed the stock higher.
The stock looks to be breaking out, and was also trending on social media sites such as StockTwits Friday afternoon. Ammo Inc. trades with a 17-millio-share float, which is slightly lower than average, meaning the stock may be subject to quick movements.
Ammo Inc. gained 7.32% Friday, closing at $7.92. 
Ammo Inc. Daily Chart Analysis
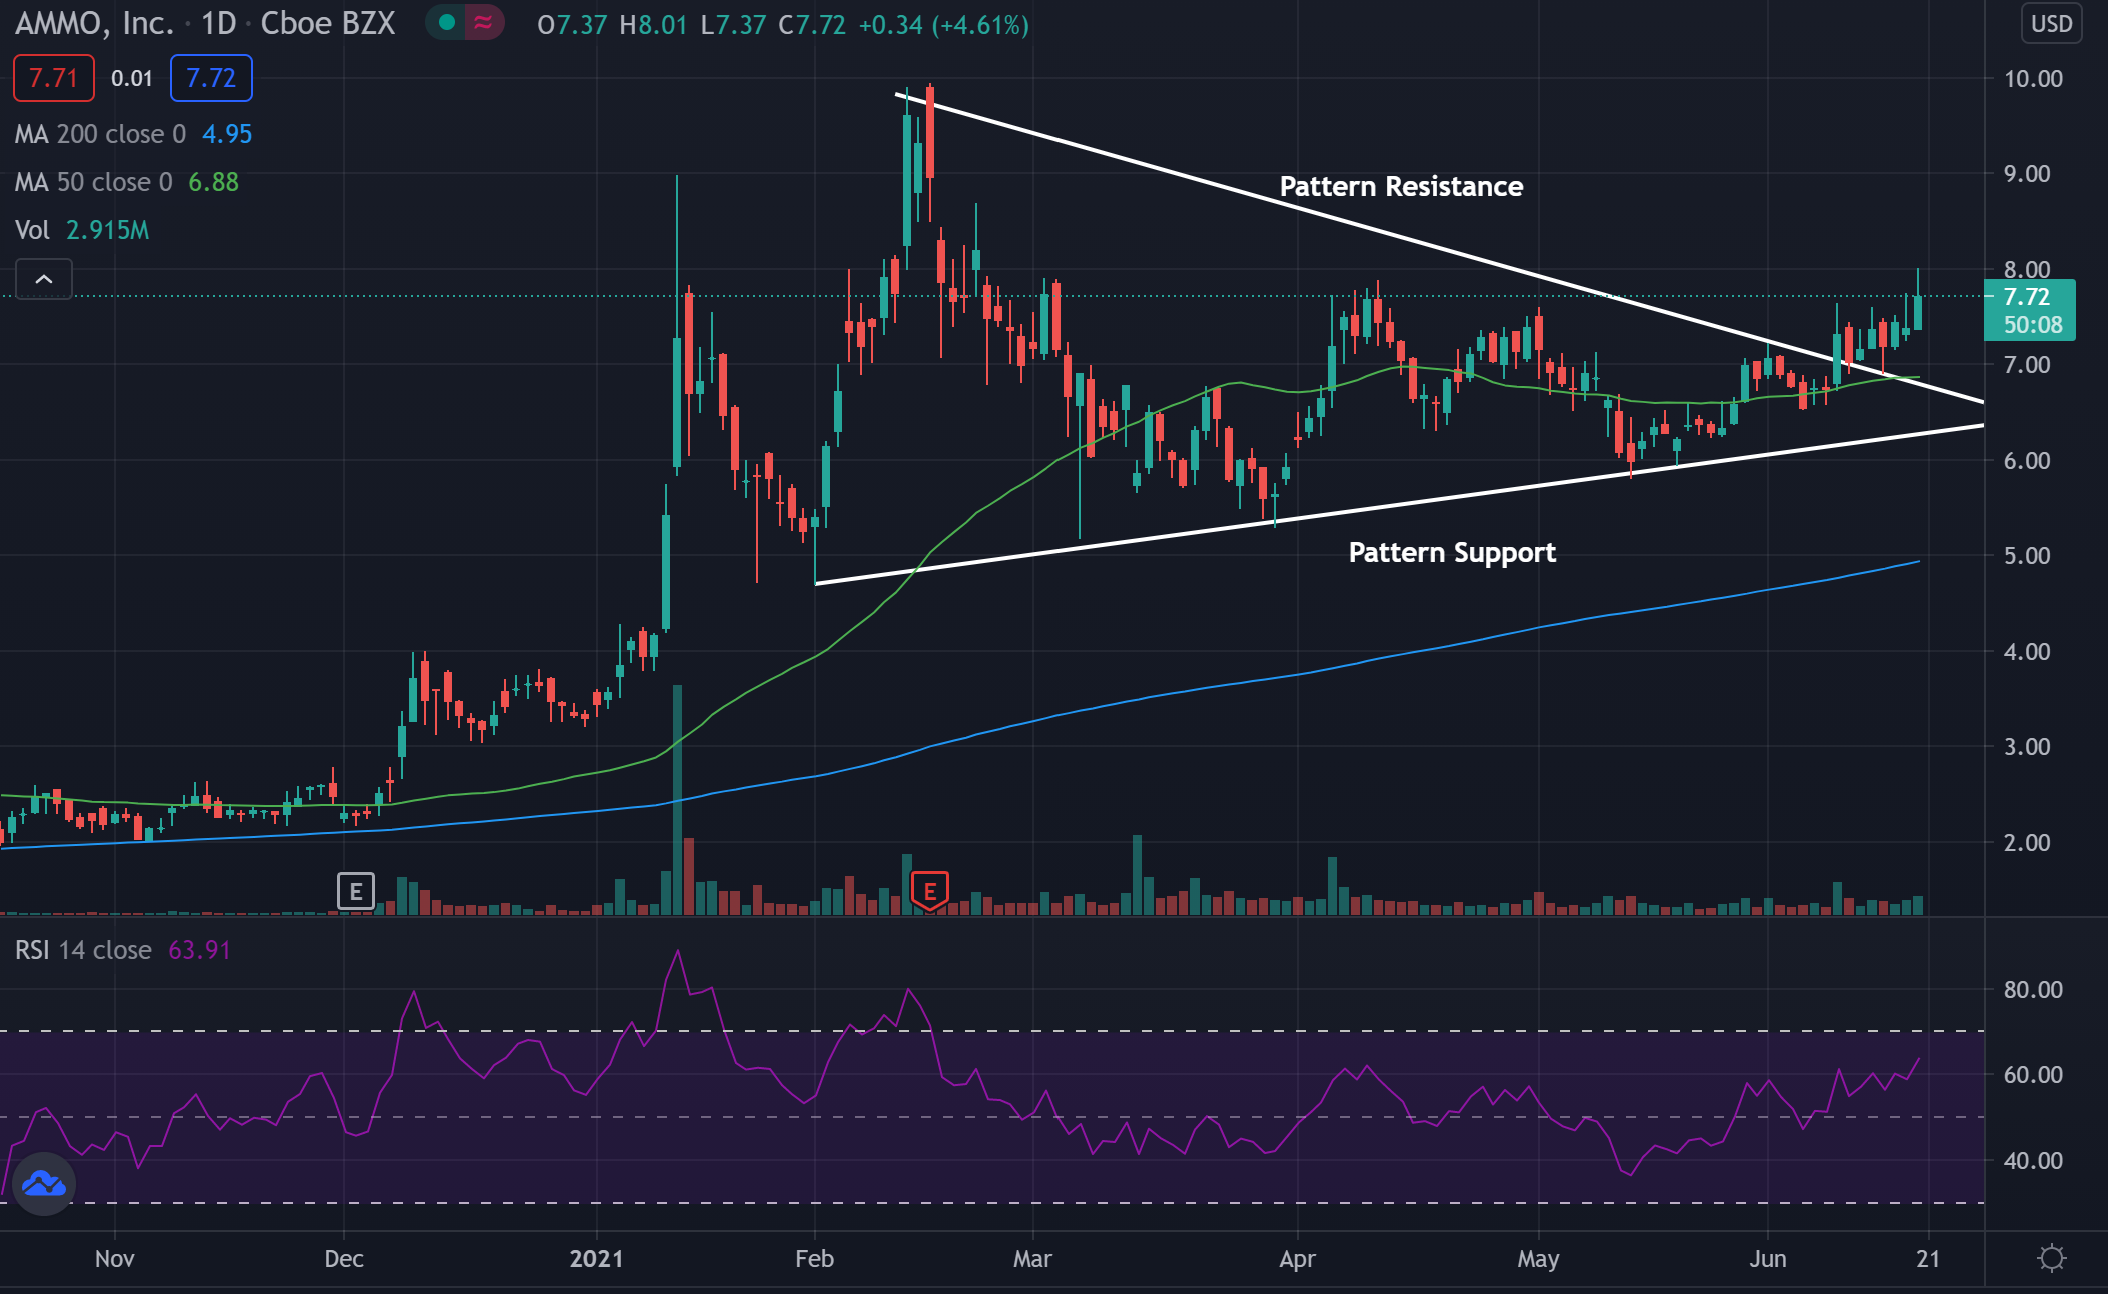
- Shares look to have broken out of what technical traders call a pennant pattern. The stock broke above pattern resistance and shares have headed higher.
- The stock is trading above both the 50-day moving average (green), and the 200-day moving average (blue), indicating sentiment in the stock is bullish.
- Each of these moving averages may hold as an area of support in the future.
Key Ammo Inc. Levels To Watch
- Shares looked to have broken out of the pennant pattern after they crossed above the pattern resistance. Shares could see continued momentum if volume in the stock continues rising.
- The pennant pattern happens after the stock makes a run up and the price is later condensed between the highs and lows until the price is able to break out of either support or resistance. Typically the stock continues momentum in the same direction as the break.
- The Relative Strength Index (RSI) shows that the stock has been becoming more overbought throughout the past couple weeks. This means more buyers are entering into the stock and there are less sellers selling the stock. The stock may reach the overbought range if it is able to reach 70 on the RSI. The stock currently sits at 63 on the RSI.
What’s Next For Ammo Inc.?
Bullish technical traders would like to see the stock continue to rise and stay above 50 on the RSI. Bears would like to see the stock continue to form higher lows and stay above the pattern support. If volume continues to come into the stock at the rate it is, now it could move higher.
Bearish technical traders would like to see the stock fall back into the pennant pattern and then drop below the pattern support. If this were to happen, the stock may change trends and see a downward push. Bears would also like to see the stock fall below 50 on the RSI.
Edge Rankings
Price Trend
© 2025 Benzinga.com. Benzinga does not provide investment advice. All rights reserved.
Trade confidently with insights and alerts from analyst ratings, free reports and breaking news that affects the stocks you care about.