Ocugen Inc. OCGN shares traded higher Tuesday after the company announced that its coronavirus vaccine co-development partner Bharat Biotech reported Phase 3 results demonstrating 77.8% protection against overall disease.
Ocugen was up 6.45% at $7.76 at last check.
Ocugen Daily Chart Analysis
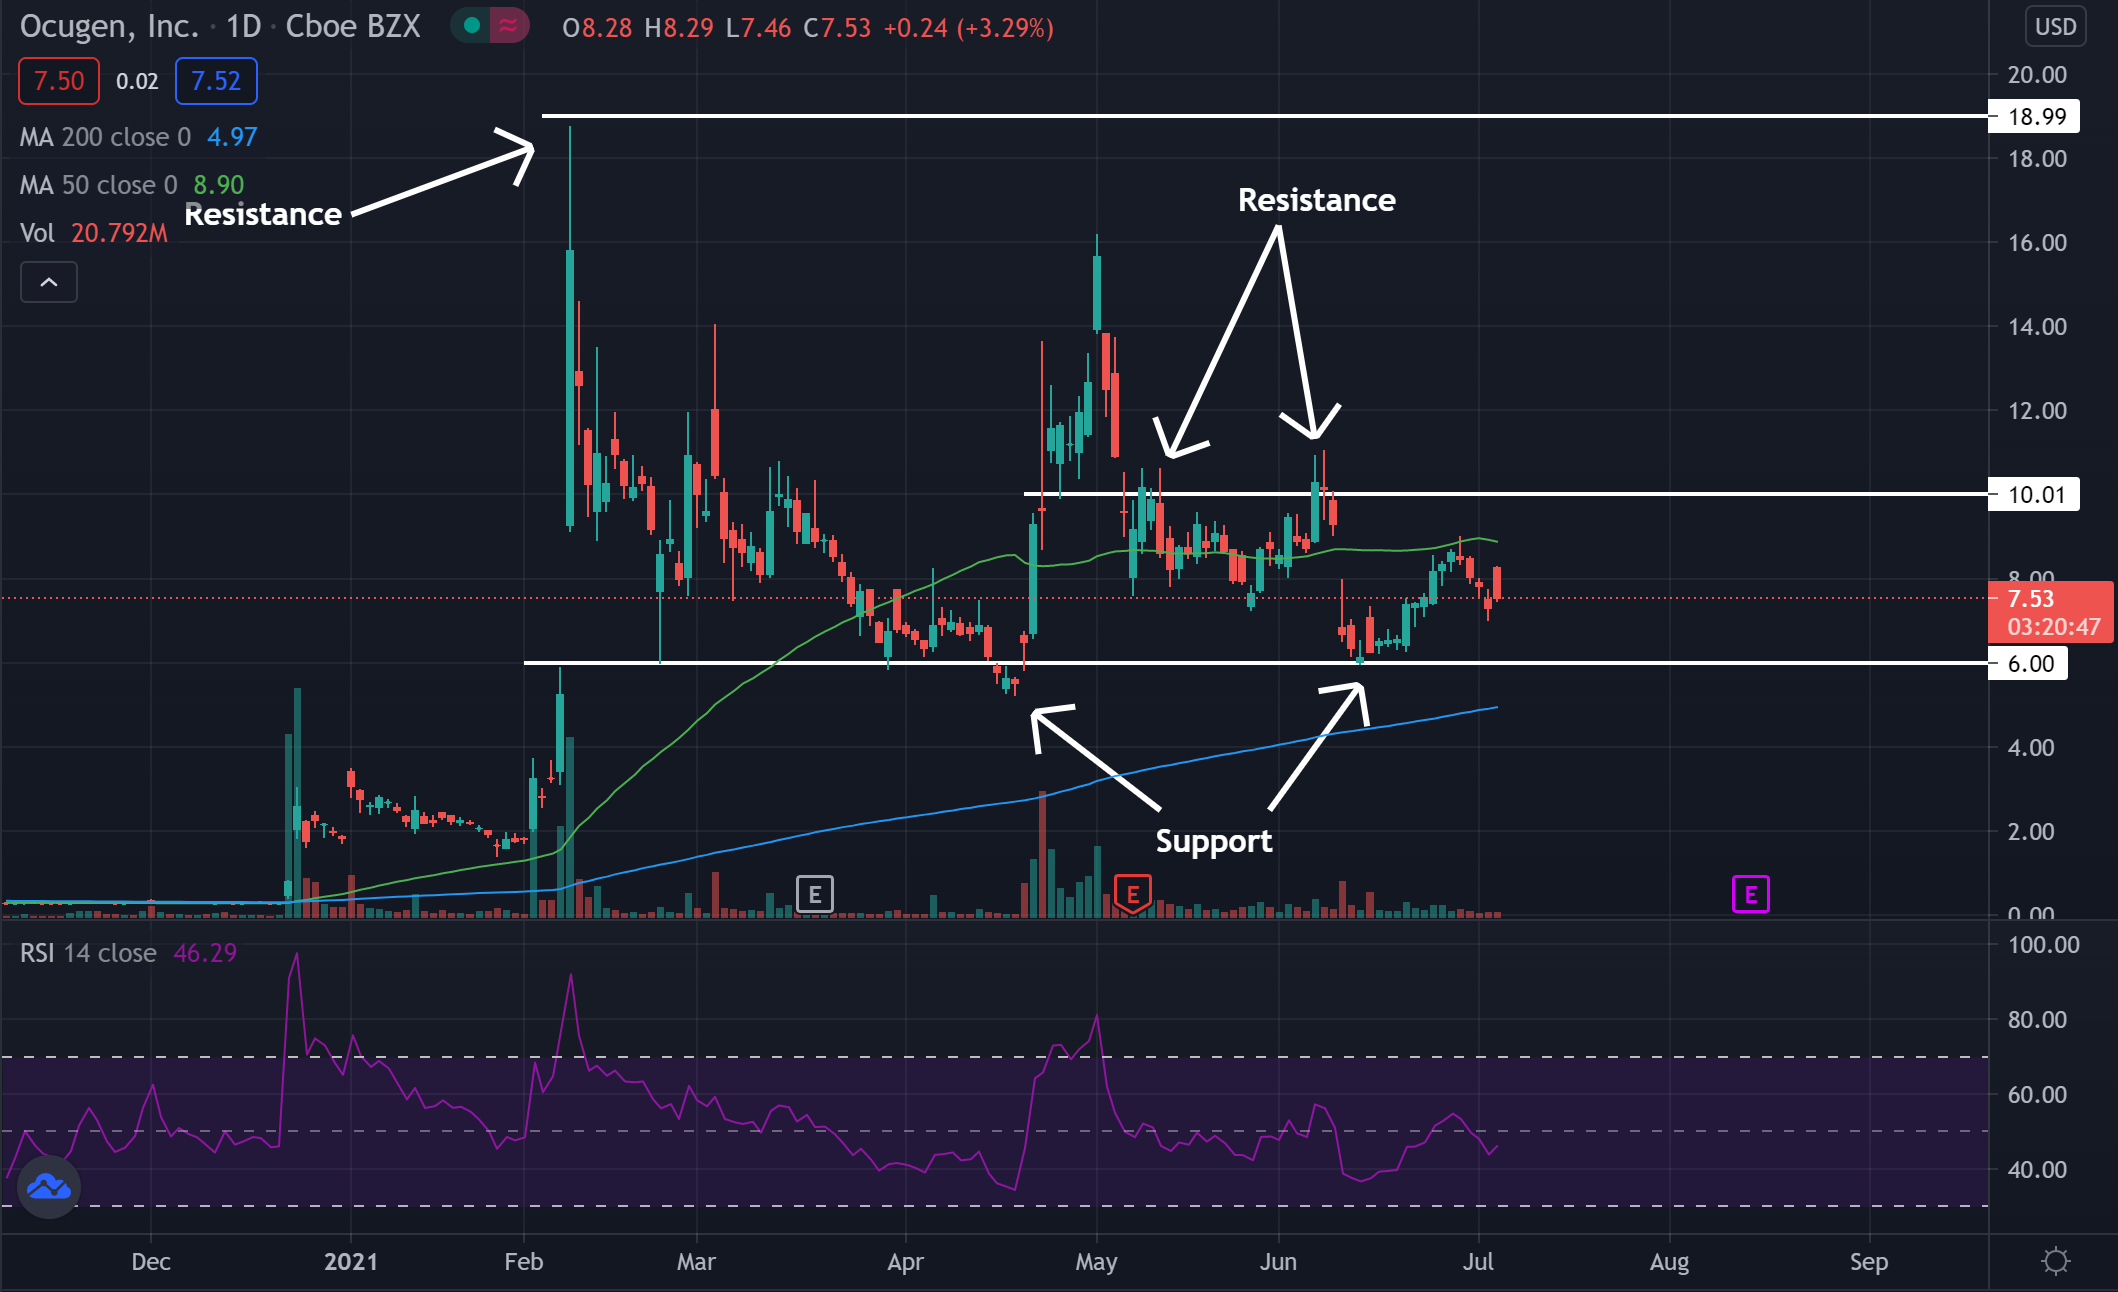
- Shares have been trading in a sideways channel and recently were able to bounce at support. Shares are approaching resistance and could see a break in the coming weeks.
- The stock is trading below the 50-day moving average (green), but above the 200-day moving average (blue), indicating the stock is likely in a period of consolidation.
- The 50-day moving average may hold as an area of resistance while the 200-day moving average may act as an area of support.
Key Ocugen Levels To Watch
- The stock was able to find support at the $6 level and started moving higher toward resistance.
- If the stock can continue to head higher, it may find resistance near the $10 level. Past the $10 level, the stock may find resistance near the $19 level.
- The Relative Strength Index (RSI) sits at 46 and has been trading sideways throughout the past couple weeks, meaning there has been a fairly equal number of buyers and sellers in recent weeks.
What’s Next For Ocugen?
Bulls would like to see the stock continue to move higher and cross above the $10 resistance level. With some consolidation above this level, the stock may see a higher move and eventually start working its way toward the $19 resistance.
Bearish traders would like to see the stock break below the $6 level. If the stock is able to break below this support level and consolidate below the level, it may see a further downward push. Bears would also like to see the RSI start falling lower and reach the oversold area.
© 2025 Benzinga.com. Benzinga does not provide investment advice. All rights reserved.
Trade confidently with insights and alerts from analyst ratings, free reports and breaking news that affects the stocks you care about.