Bitcoin BTC/USD bust through the $42,000 level on Friday after breaking up from a bull flag Benzinga called out on Monday. The cryptocurrency works in cycles and after the leaders, which includes Ethereum ETH/USD, break out traders take their profits and put them into alt-coins.
Ethereum Classic ETC/USD and Baby Doge BABYDOGE/USD could benefit when the next alt-coin bull market takes place and they are already showing bullish patterns in preparation.
See Also: How to Buy Ethereum Classic
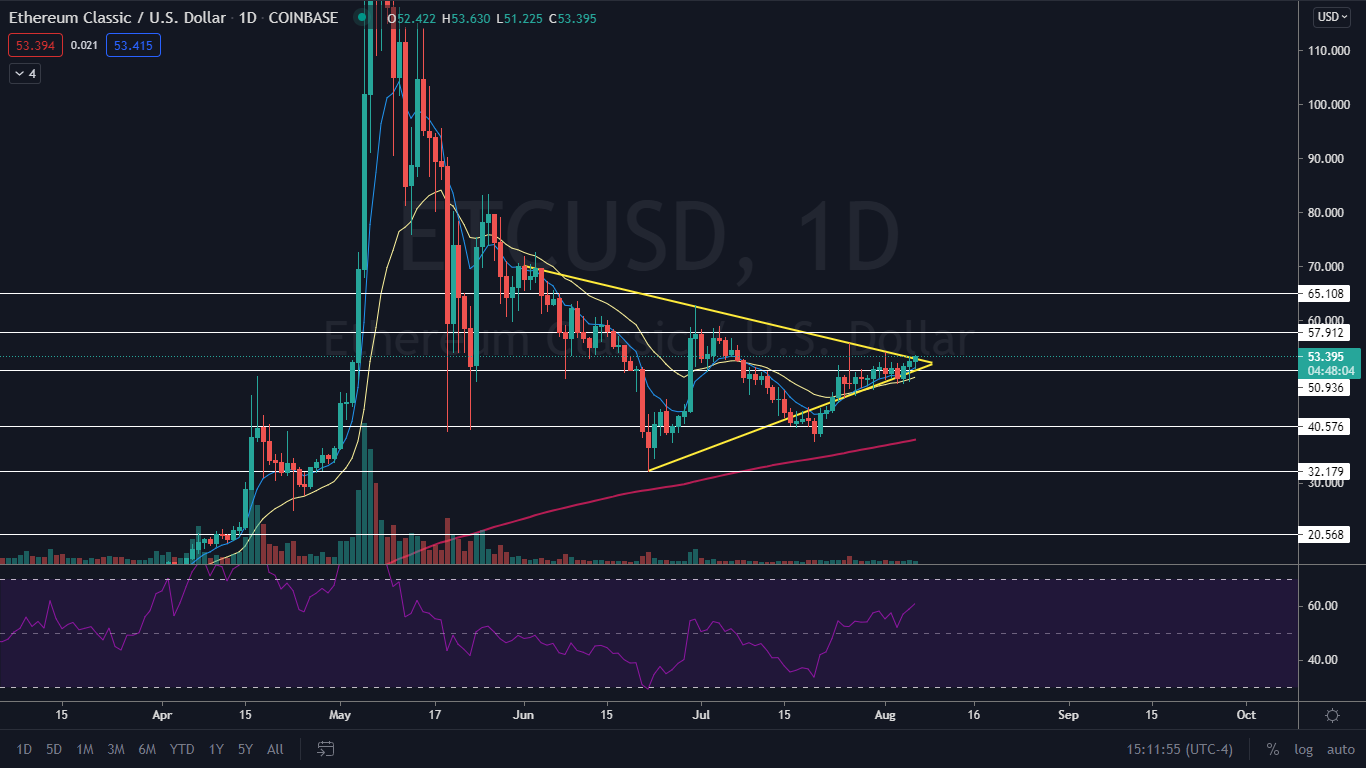
The Ethereum Classic Chart: On Friday, Ethereum Classic was attempting to break up from a triangle formation. The descending line of the triangle has been holding the crypto down since June 1 and Ethereum Classic has attempted to break up from it on eight separate occasions and failed. Ethereum Classic will hit the apex of the triangle on Aug. 9 and traders should expect either a bullish or bearish break before then.
In order to know if the pattern was recognized on the break from the triangle, traders will need to watch for increasing volume to come into Ethereum Classic. If volume does not enter on the break of the triangle, Ethereum Classic could continue to trade in a sideways pattern for a longer period of time.
The crypto is trading above the eight-day and 21-day exponential moving averages with the eight-day EMA trending above the 21-day, which is a bullish indicator. Ethereum Classic is also trading above the 200-day simple moving average (SMA) which indicates overall sentiment in the crypto is bullish.
- Bulls want to see big bullish volume enter Ethereum Classic to get a daily close above the descending trendline. If the crypto can make the break it has room to push up to a resistance level at $57.91.
- Bears want to see Ethereum Classic drop through the ascending trendline of the pattern and lose a support level at $50.93. If the crypto loses the level at support it could fall toward the $40.57 mark.

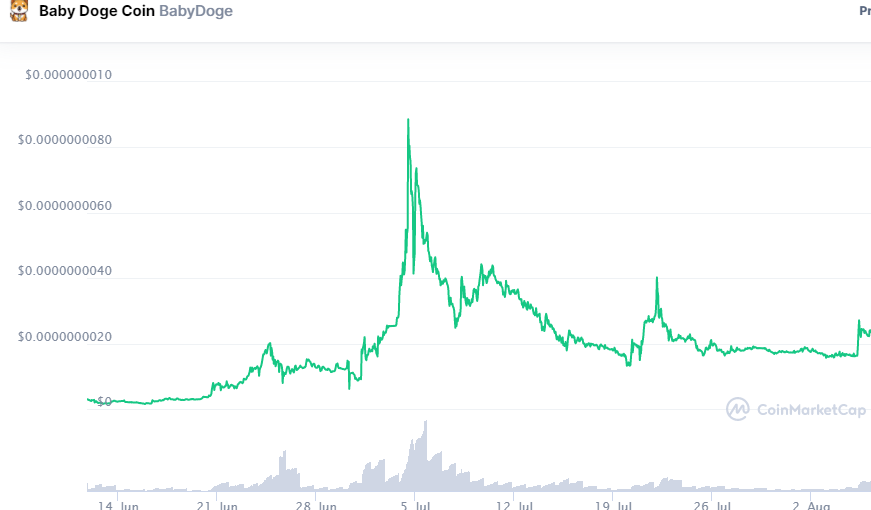
The Baby Doge Chart: Baby Doge looks to have found a bottom between Aug. 3 and 4 near the $0.0000000016 level. In the early morning hours of Aug. 5, Baby Doge woke up and ran to the $0.0000000027 level before entering into consolidation at about 9 a.m. EST. The crypto then consolidated down to the $0.0000000020 level through to Friday afternoon.
The rise up paired with the consolidation has settled Baby Doge into a bull flag pattern. If the pattern is recognized, traders will want to watch for big bullish volume to come in and push the coin up to a new high over $0.000000002711.
- Bulls want to see big bullish volume enter Baby Doge to break it up from the pattern. Baby Doge has resistance near $0.0000000026 and $0.000000003.
- Bears want to see Baby Doge continue to trend downward to negate the bull flag pattern. Baby Doge has support at $0.000000002 and $0.0000000018.

Photo: Courtesy Baby Doge and Ethereum Classic)
© 2025 Benzinga.com. Benzinga does not provide investment advice. All rights reserved.
Trade confidently with insights and alerts from analyst ratings, free reports and breaking news that affects the stocks you care about.