


SoFi Technologies Inc SOFI shares were trading lower Tuesday morning, although there looks to be no evident company news to explain the drop. The stock was trending throughout the day on social media sites.
The stock hit a new 52-week low of $13.72.
SoFi Technologies was down 3.15% at $13.84 at last check early Tuesday afternoon.
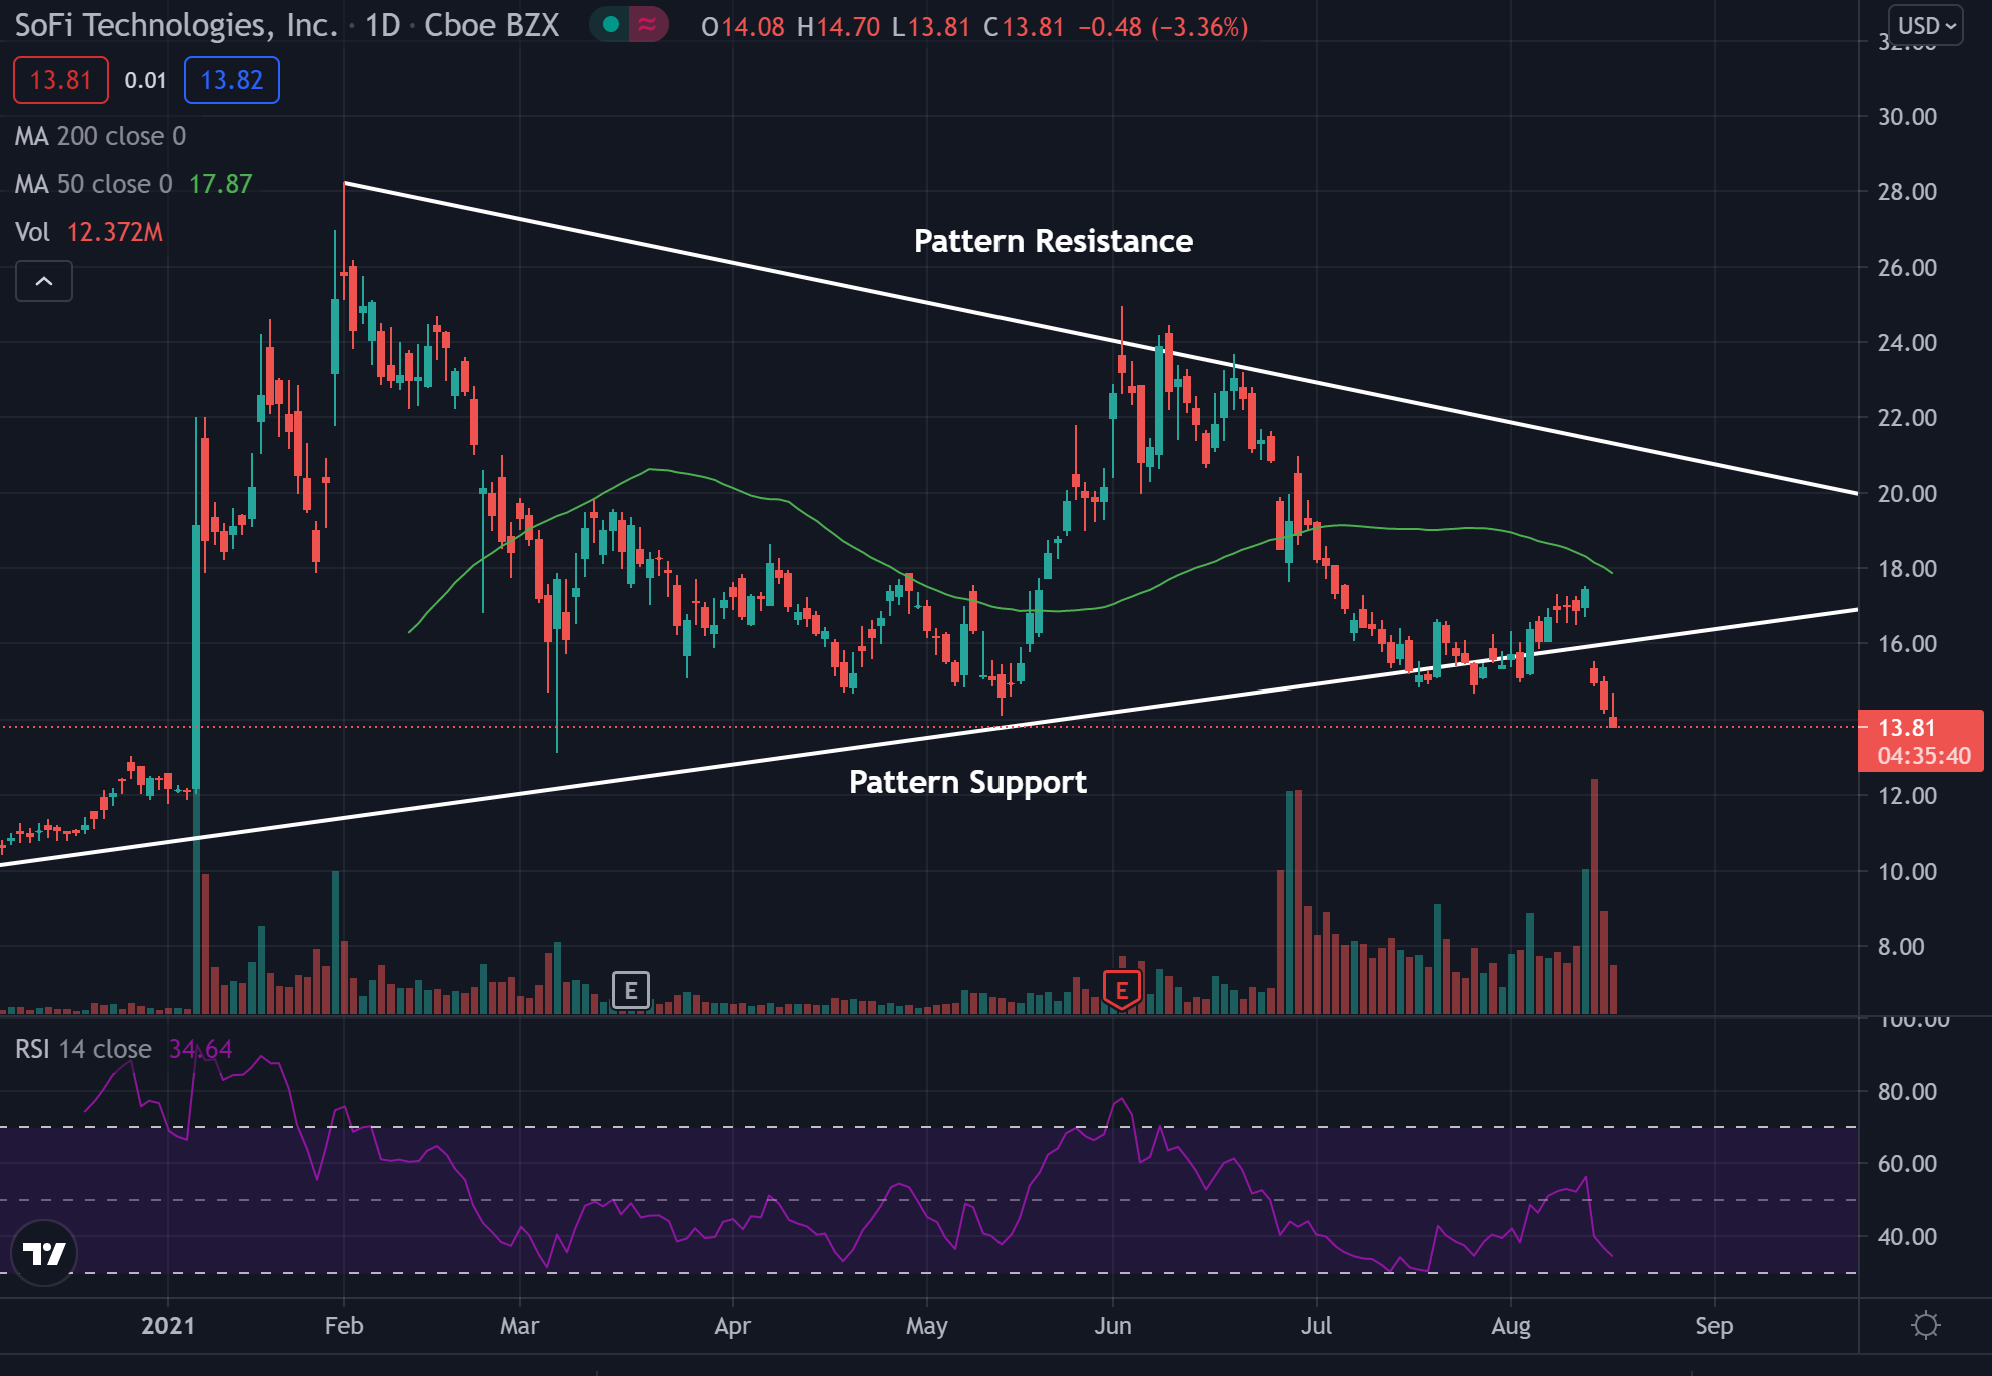
SoFi Technologies Daily Chart Analysis
- Shares dipped Tuesday and look to have broken below pattern support, possibly hinting the pattern has broken.
- The stock is trading below the 50-day moving average (green), indicating sentiment in the stock has been bearish.
- This moving average may hold as an area of resistance in the future.
- The price dropped below pattern support. A consolidation below this level and the stock could be due to having another lower push.
- The Relative Strength Index (RSI) has been dipping lower and now sits at 35. The sharp drop shows there was a large increase in the amount of sellers in the stock.
What’s Next For SoFi Technologies?
Bullish traders would like to see the stock bounce and start forming higher lows. Bulls would then like to see the stock move back into the pennant pattern push toward resistance. Eventually, bulls would like to see a breakout above resistance and a further bullish move.
Bears would like to see the stock continue to move lower and consolidate below pattern support. Consolidation below support may allow the stock to see a further bearish push.
See also: SOFI WEALTH REVIEW
Edge Rankings
Price Trend
© 2025 Benzinga.com. Benzinga does not provide investment advice. All rights reserved.
Trade confidently with insights and alerts from analyst ratings, free reports and breaking news that affects the stocks you care about.

