CNBC's Jim Cramer went on air Monday to advise cryptocurrency investors to take some of their profits out on fears China would stand strong on its decision to leave Evergrande Group EGRNY to find its own bailout or go into default.
Ethereum ETH/USD fell 20% lower over the course of Monday and Tuesday before rebounding slightly. On Wednesday Ethereum was showing strength, however, and was trading up over 10% higher at one point. The crypto seems to have become stronger than Bitcoin BTC/USD which was trading up about 5%.
See Also: How to Buy Ethereum Classic
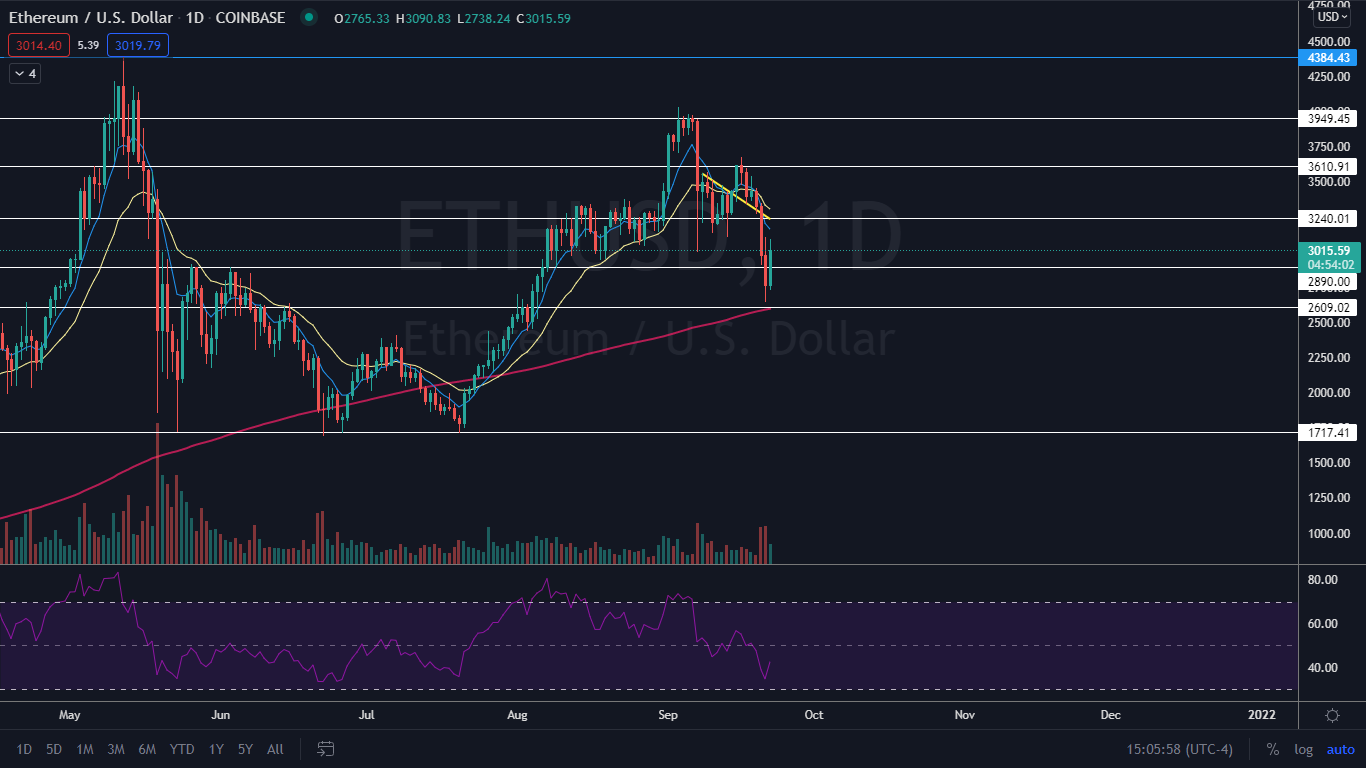
The Ethereum Chart: Ethereum was working on printing a big bullish Marubozu candlestick and if the crypto closes the day at or above the $3,000 mark the candle could indicate higher prices will come on Thursday. It would be bullish if the crypto is able to surpass Tuesday’s high of $3,102.55.
Technical traders may have seen Wednesday’s bullish price action in advance because the crypto’s relative strength index (RSI) dropped to 35% on the previous day. When a stock or crypto’s RSI nears or reaches the 30% level, it becomes oversold which is a buy signal. When Ethereum’s RSI reached the same low level on July 20, the crypto rallied 130% higher over the course of the following six weeks.
Ethereum is trading below the eight-day and 21-day exponential moving averages (EMAs) and the eight-day EMA has crossed below the 21-day, which indicates short-term sentiment has become bearish. The crypto is still trading above the 200-day simple moving average (SMA), however, which indicates the overall sentiment remains bullish.
- Bulls want to see larger bullish volume come in on Thursday to confirm the Marubozu candle and drive Ethereum’s price up above the $3240 level. If the crypto can regain the level as support, it could trade back up toward $3,610.
- Bears want to see big bearish volume come into Ethereum to drive the price back down below $2,890. If the crypto loses the level as support it could fall toward its next support level at the $2,609 mark which aligns with the 200-day SMA.

Edge Rankings
Price Trend
© 2025 Benzinga.com. Benzinga does not provide investment advice. All rights reserved.
Trade confidently with insights and alerts from analyst ratings, free reports and breaking news that affects the stocks you care about.