
Tesla Inc. TSLA shares are trading higher Friday, and the stock has been trending on social media sites throughout the day.
Tesla was up 1.7% at $766.47 at last check. Here's a technical look at the stock.
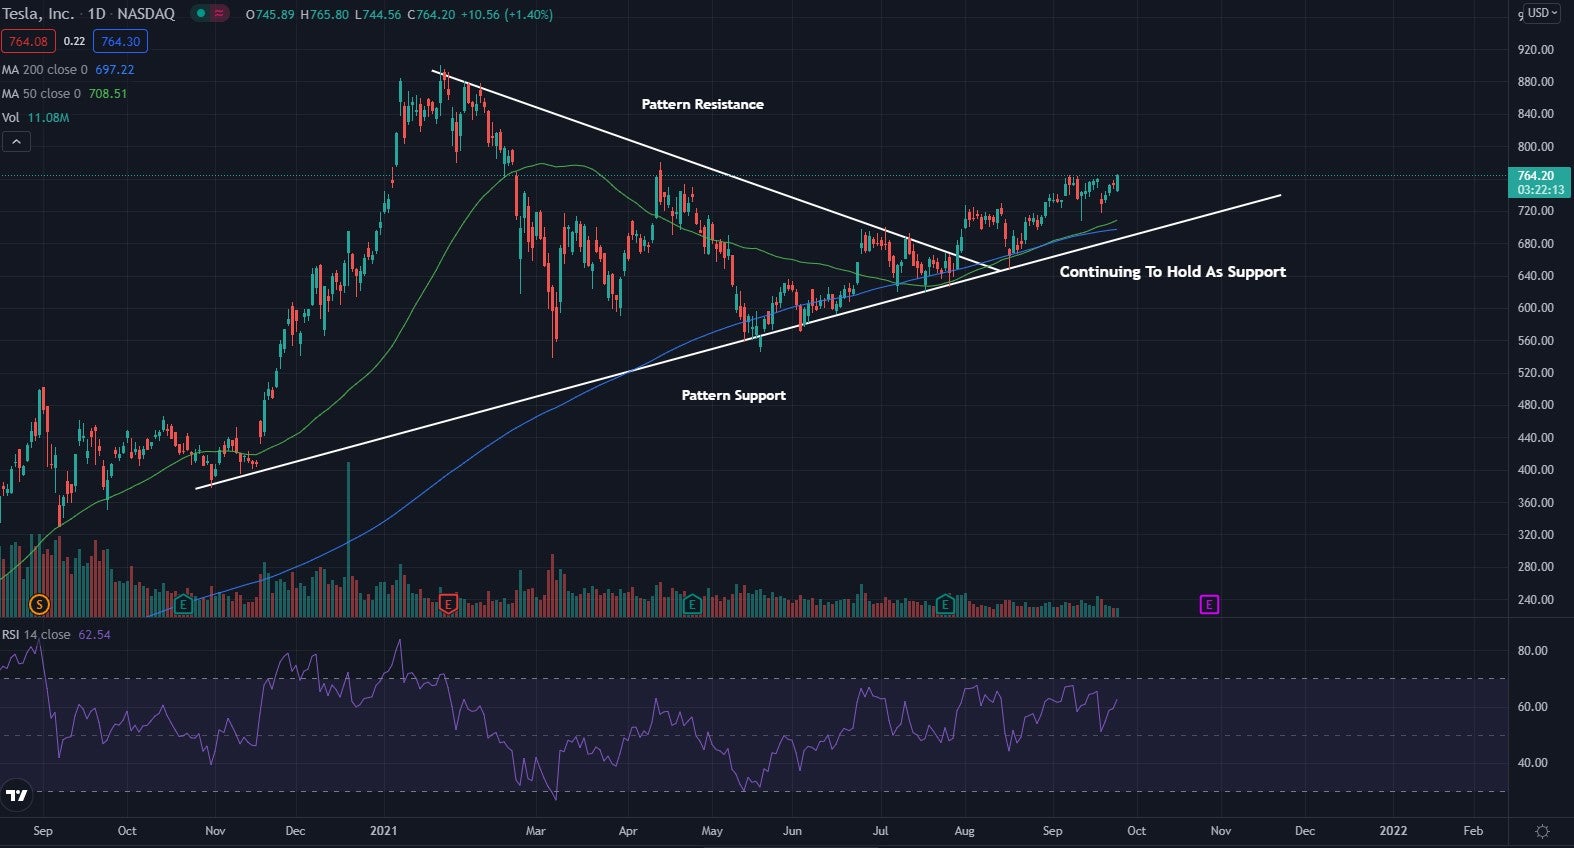
Tesla Daily Chart Analysis
- The stock broke out of what technical traders call a pennant pattern and has continued to trade above the pattern support. This support may continue to hold even though the pattern looks to have finished.
- After being condensed between narrowing highs and lows, the stock saw a breakout. The pattern support line is turning into a normal higher low trendline and may continue to hold as support in the future.
- The stock trades above both the 50-day moving average (green), and the 200-day moving average (blue), indicating the stock is likely facing a period of bullish sentiment.
- Each of these moving averages may hold as a potential area of support in the future.
- The Relative Strength Index (RSI) has been trading sideways above the middle line. This shows that the stock has had more buying pressure than selling pressure throughout the past few weeks.
What’s Next For Tesla?
Bullish traders look to have control of the stock and would like to maintain it. For bulls to maintain control of the stock, they would like to see the stock stay above the higher low trendline while also holding above the moving averages.
Bearish traders are looking to see the stock fall below the support trendline and the moving averages. This may cause a possible change in trend and for the stock to start heading lower. Bears would then like to see the stock begin to form lower highs.
© 2025 Benzinga.com. Benzinga does not provide investment advice. All rights reserved.
Trade confidently with insights and alerts from analyst ratings, free reports and breaking news that affects the stocks you care about.

