The following post was written and/or published as a collaboration between Benzinga’s in-house sponsored content team and a financial partner of Benzinga.
AUD/USD Current Price: 0.7311
- A recovery in global indexes sent the AUD/USD pair to a fresh three-week high.
- Australian AIG Performance of Services Index printed at 45.7 in September, from 45.6 previously.
- AUD/USD is mildly bullish in the near term, needs to break above 0.7330.
The Australian dollar benefited from a risk-on scenario, surging against its American rival to 0.7323, its highest in three weeks. AUD/USD holds on to gains ahead of the Asian opening, trading at around 0.7310. The better tone of global indexes has provided support to the pair, despite tepid Australian data released at the beginning of the day. The September AIG Performance of Services Index printed at 45.7, slightly better than the previous 45.6 but still in contraction territory.
On Friday, the Reserve Bank of Australia will publish the Financial Stability Review report, while the US will publish its monthly employment figures. US Federal Reserve chief Jerome Powell has said that a good employment report could be enough to convince him on tapering, hence the relevance of the Nonfarm Payroll report. The country is expected to have added 488K new jobs in September, while the Unemployment Rate is foreseen at 5.1% from 5.2% in the previous month.
AUD/USD short-term technical outlook
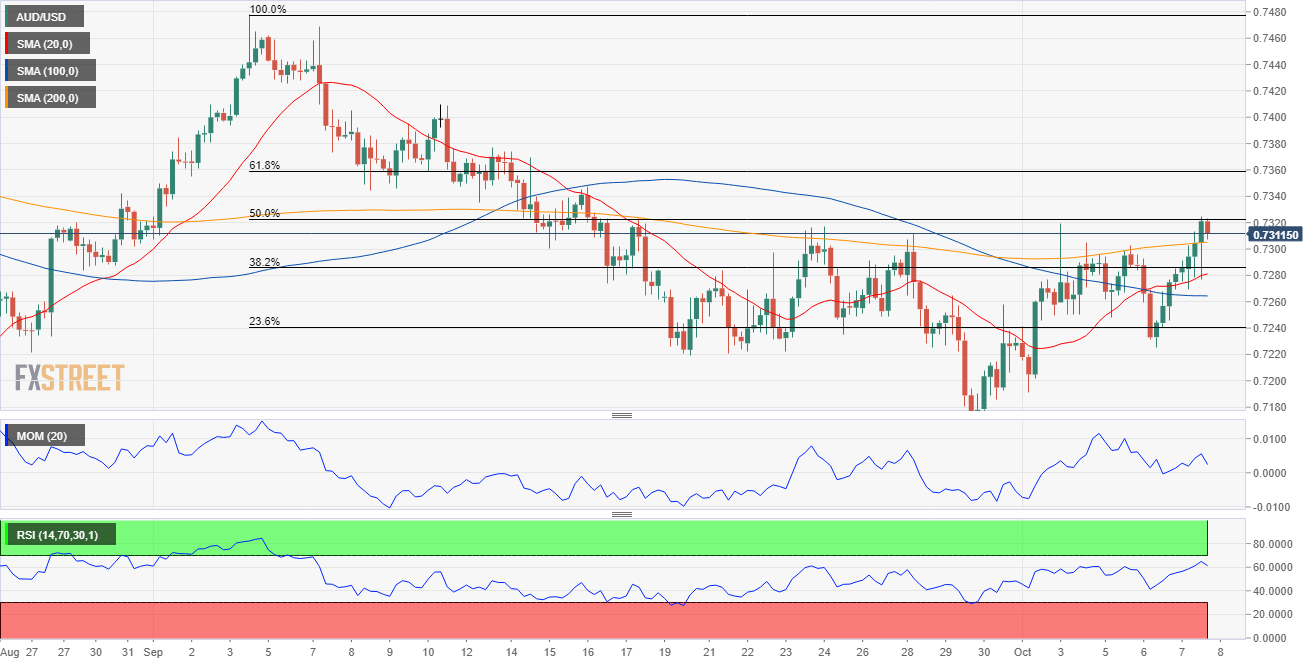
The AUD/USD pair has reached the 50% retracement of its latest daily decline and could extend its gains in the near term. The daily chart shows that it managed to advance beyond its 20 SMA, which maintains its bearish slope. At the same technical indicators head firmly higher within positive levels, supporting another leg north if the pair overcomes the 0.7330 price zone.
In the near term, and according to the 4-hour chart, the pair the risk skews to the upside, although the momentum is limited. The pair has settled above all of its moving averages, with the 20 SMA heading firmly north above the 100 SMA. However, technical indicators have lost their strength upward, although holding within positive levels.
Support levels: 0.7290 0.7250 0.7225
Resistance levels: 0.7330 0.7370 0.7410
Image Sourced from Pixabay
The preceding post was written and/or published as a collaboration between Benzinga’s in-house sponsored content team and a financial partner of Benzinga. Although the piece is not and should not be construed as editorial content, the sponsored content team works to ensure that any and all information contained within is true and accurate to the best of their knowledge and research. This content is for informational purposes only and not intended to be investing advice.
© 2025 Benzinga.com. Benzinga does not provide investment advice. All rights reserved.
Trade confidently with insights and alerts from analyst ratings, free reports and breaking news that affects the stocks you care about.
