

Globalstar Inc. GSAT shares traded higher Wednesday. The stock is trading in a technical pattern and is possibly bouncing off a key support level.
Globalstar was up 4.43% at $1.65 at the close.
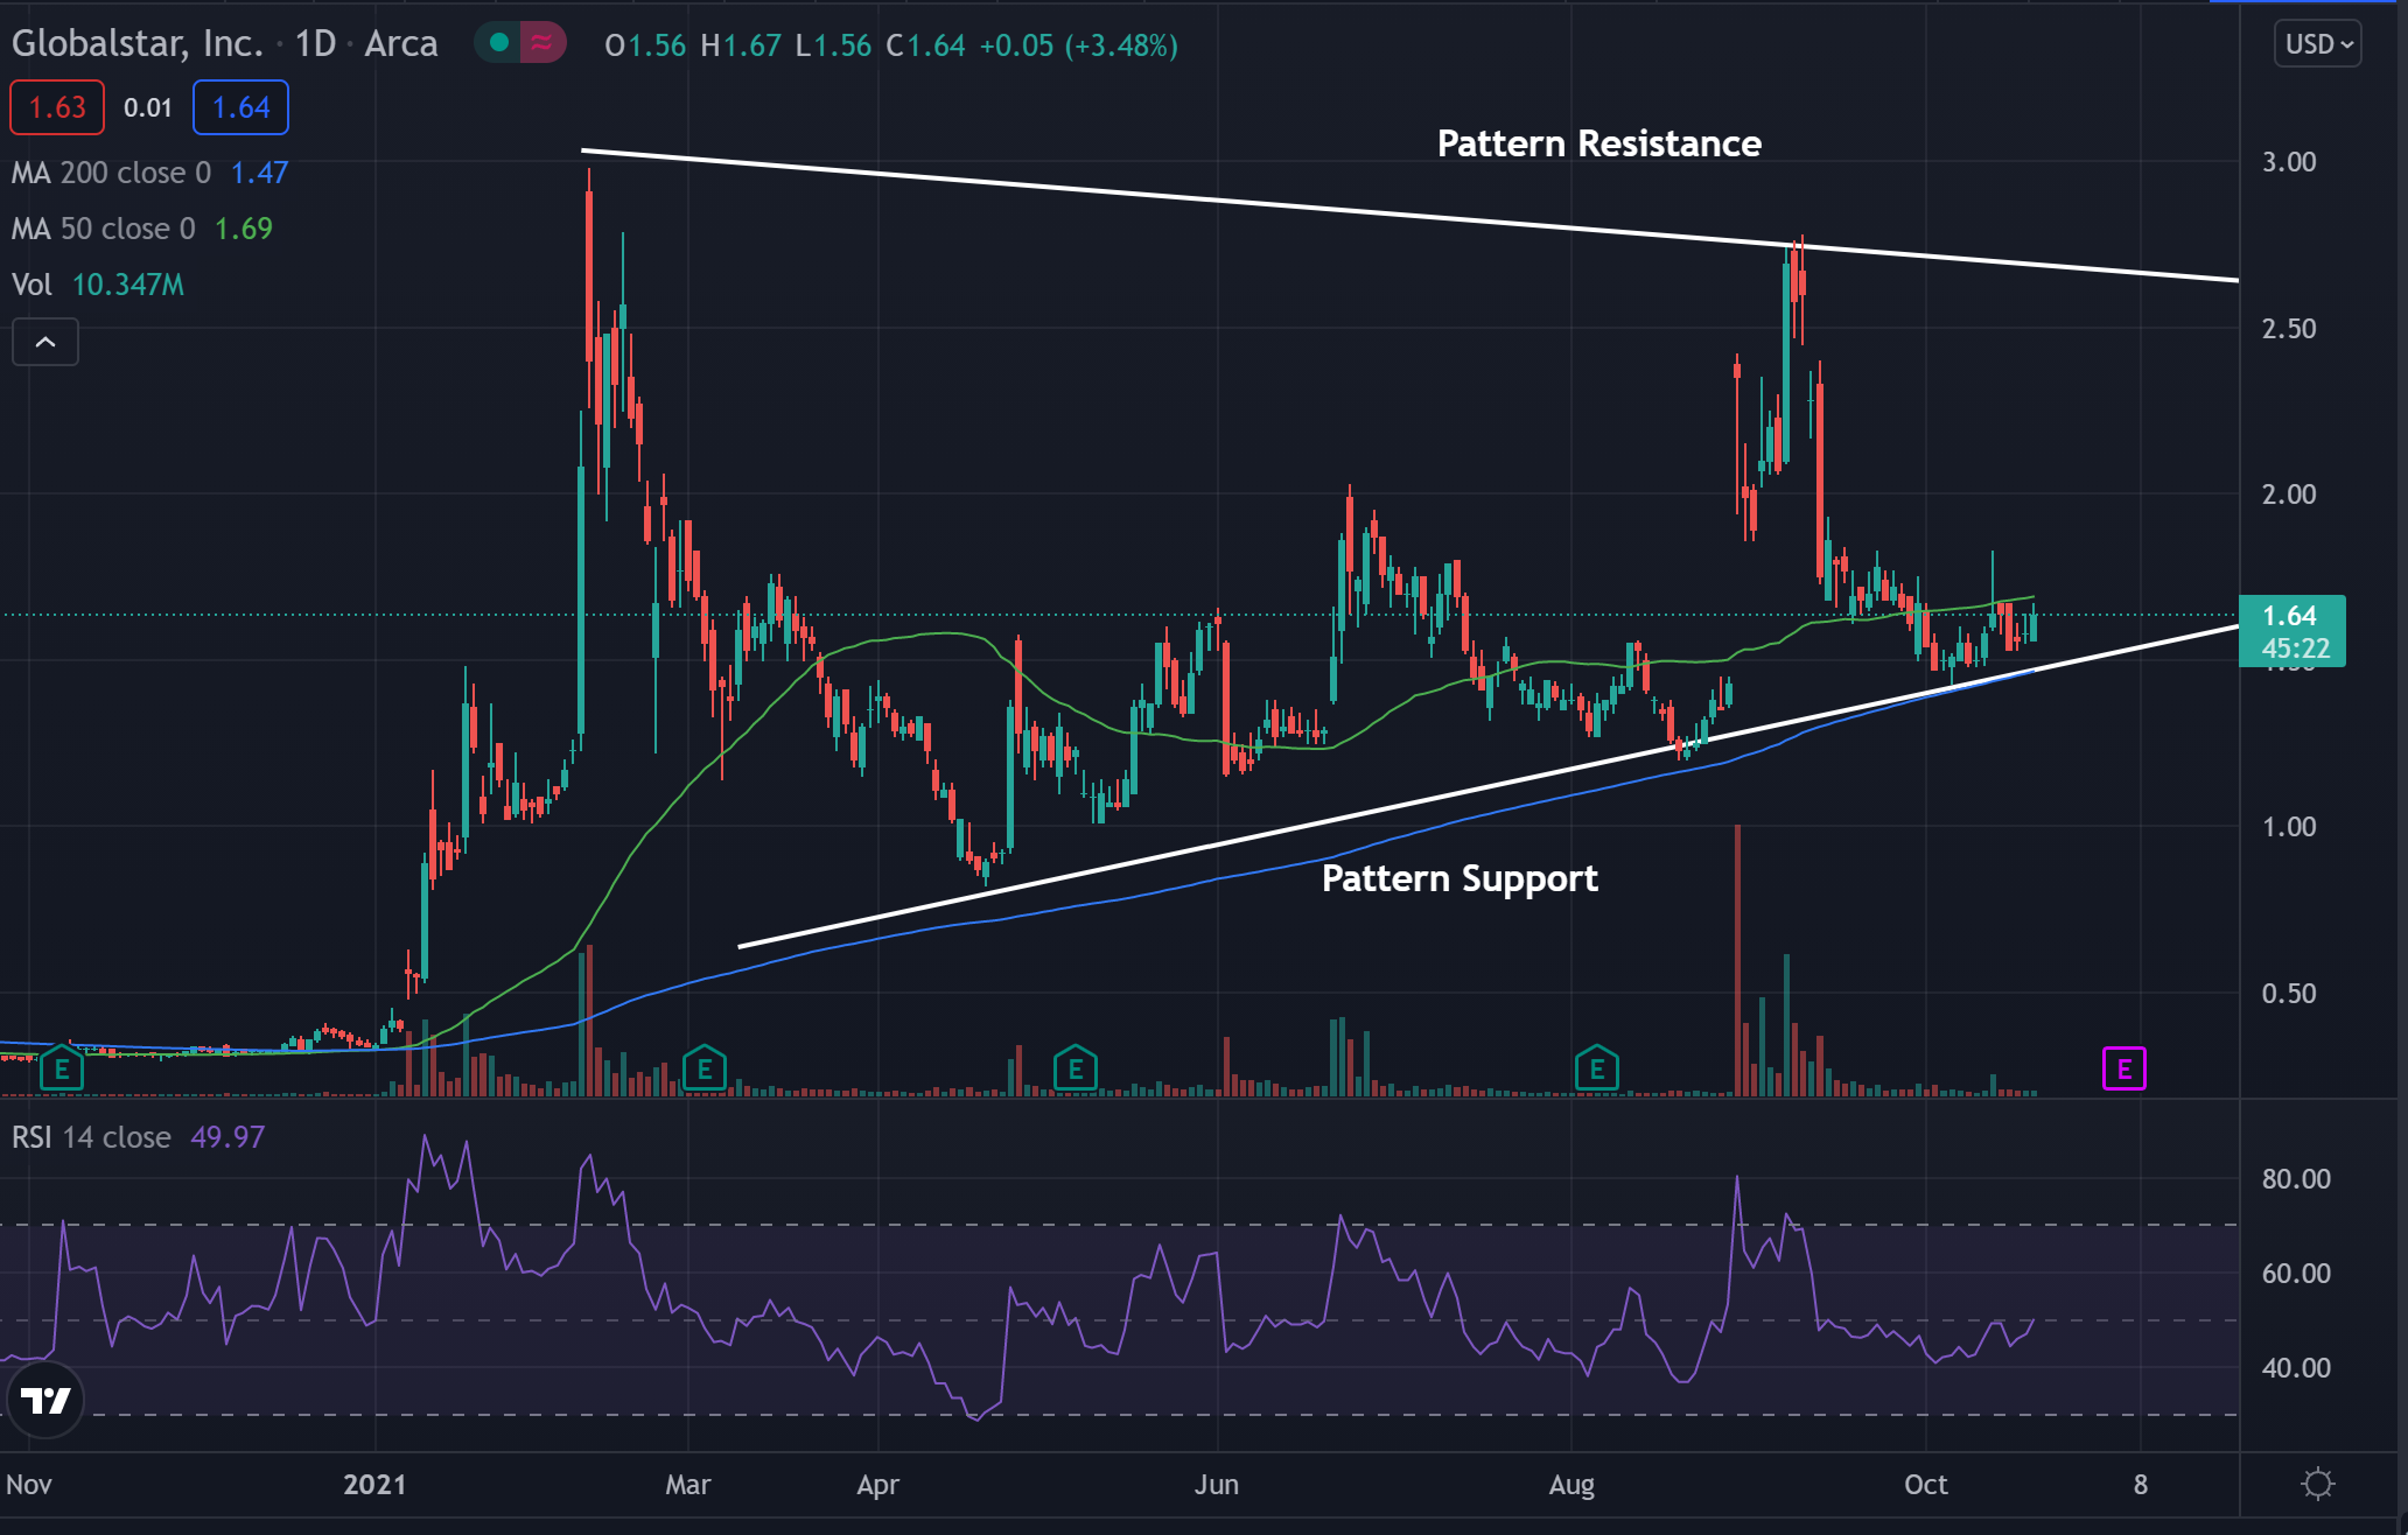
Globalstar Daily Chart Analysis
- The stock looks to be bouncing off pattern support in what technical traders call a pennant pattern.
- The stock has been getting pinched between higher lows and lower highs, and could see a break of either pattern support or resistance in the coming weeks.
- The stock is trading below the 50-day moving average (green), but above the 200-day moving average (blue), indicating the stock is likely facing a period of consolidation.
- The 50-day moving average may act as a place of resistance, while support may be found near the 200-day moving average.
- The Relative Strength Index (RSI) has been creeping higher and now sits at 50 on the indicator. The RSI sitting in the middle of the indicator shows there is an equal amount of buying and selling pressure in the stock.

What’s Next For Globalstar?
Bullish traders are looking to see the stock hold above the pattern support and continue to trade within the pattern. A push away from support and a move closer to resistance is a short-term goal for bulls. Bulls would then like to see the stock break above the pattern resistance and make a push higher.
Bearish traders would like to see the stock fall below pattern support and begin to hold it as a place of resistance. If this were to happen the stock could be ready to see a further downward push.
Edge Rankings
Price Trend
© 2025 Benzinga.com. Benzinga does not provide investment advice. All rights reserved.
Trade confidently with insights and alerts from analyst ratings, free reports and breaking news that affects the stocks you care about.

