EUR/USD Current price: 1.1608
- The European Central Bank is expected to pave the way for a tighter monetary policy.
- US Q3 Gross Domestic Product is foreseen at 2.7%, sharply down from the previous 6.7%.
- EUR/USD keeps consolidating around the 1.1600 figure ahead of first-tier events.
The EUR/USD pair trades in the 1.1610 price zone, recovering from its recent lows in the 1.1580 area amid decreasing demand for the American currency. The dollar fell alongside US government bond yields, particularly long-term ones. The yield on the 10-year Treasury note fell to 1.52%, while that on the 2-year note ticked higher and stands around 0.50%. At the same time, stocks markets are on the backfoot, with most US indexes trading in the red, despite another batch of solid earnings reports. Market participants are now pricing its latest tapering-related concerns after the Bank of Canada announced the end of its QE program.
On the data front, Germany published the November GFK Consumer Confidence, which improved from 0.4 to 0.9, beating expectations. However, the September Import price Index was up a modest 1.3% in the month. Also, the EU reported September Money Supply, which increased by 7.4%, missing expectations. As for the US, the country released September Durable Goods Orders, which fell by 0.4% MoM, better than the -1.1% expected. The preliminary estimate of the September Goods Trade Balance posted a deficit of $96.3 billion, larger than the previous $-89.4 billion.
The focus now shifts to the European Central Bank monetary policy decision and the preliminary estimate of US Q3 Gross Domestic Product, both scheduled for Thursday. The ECB is widely anticipated to maintain its monetary policy unchanged, but policymakers may pave the way for a tighter monetary policy. On the other hand, the US economy is expected to have grown 2.7% in Q3, down from 6.7% in Q2.
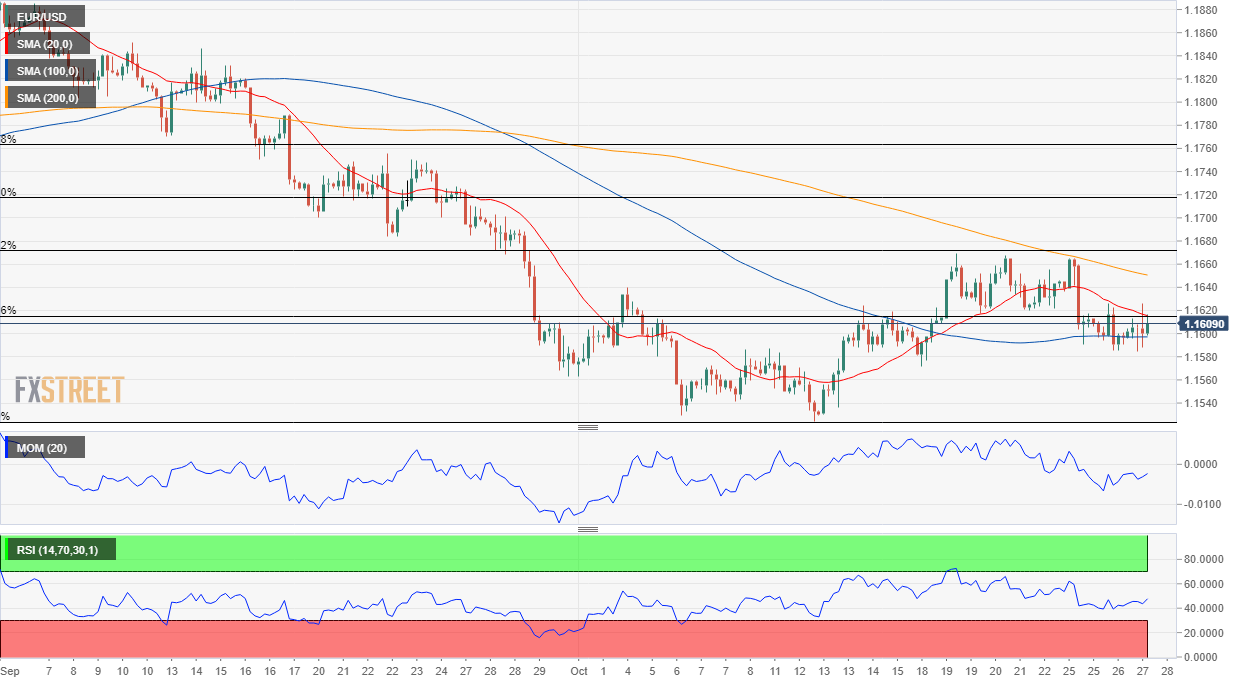
EUR/USD short-term technical outlook
The EUR/USD pair keeps trading around the 23.6% retracement of its latest daily decline at 1.1615. The daily chart shows that the pair is also hovering around a bearish 20 SMA, while the longer ones maintain their bearish slopes well above the current level. Technical indicators are heading marginally higher, although the Momentum is within neutral levels, while the RSI remains below its midline.
The 4-hour chart shows that the pair has found support around a flat 100 SMA while the pair battles a mildly bearish 20 SMA. The Momentum indicator aims north, crossing its midline into positive levels, but the RSI remains flat around its midline, reflecting limited buying interest. The pair needs to break above 1.1670, the next Fibonacci resistance level, to gain further strength, while bears could take control on a break below 1.1570, October 18 daily low.
Support levels: 1.1570 1.1525 1.1480
Resistance levels: 1.1670 1.1715 1.1750
Image Sourced from Pixabay
© 2025 Benzinga.com. Benzinga does not provide investment advice. All rights reserved.
Trade confidently with insights and alerts from analyst ratings, free reports and breaking news that affects the stocks you care about.

