


Japanese gameshow contestant versus bear. Image via TMZ.
A Different Approach To Limiting Risk
A conventional approach to limiting risk in investing is to put more of your money in assets that are unlikely to go up or down a lot, like short duration government bonds. Our approach is different: buy and hedge a handful of securities that
- We estimate are likely to do well over the next six months, and
- Are inexpensive to hedge relative to our estimates of their potential returns.
Because you're hedged, you can concentrate your assets in a handful of names; because you're concentrated, you will do well if one of those names does well.
Here's an example of that approach in action.
If You Were Unwilling To Risk A >20% Decline
On May 6th, if you indicated on our website that you were unwilling to risk a decline of more than 20% over the next six months, this is the portfolio the site would have presented you, depending on the size of your account:

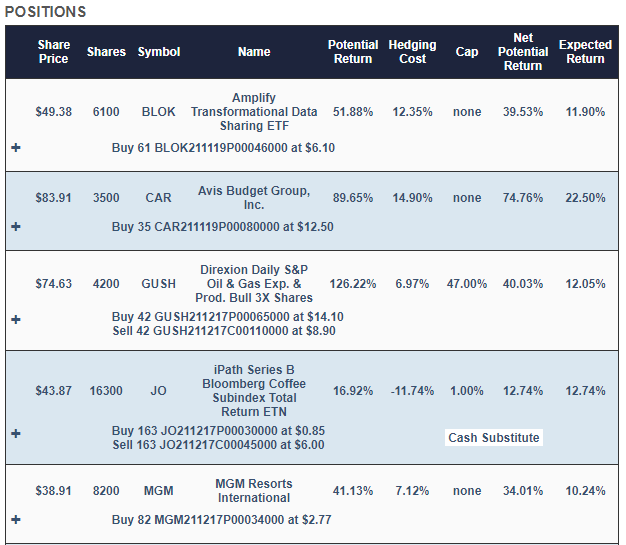

Screen captures via Portfolio Armor on 5/6/2021.
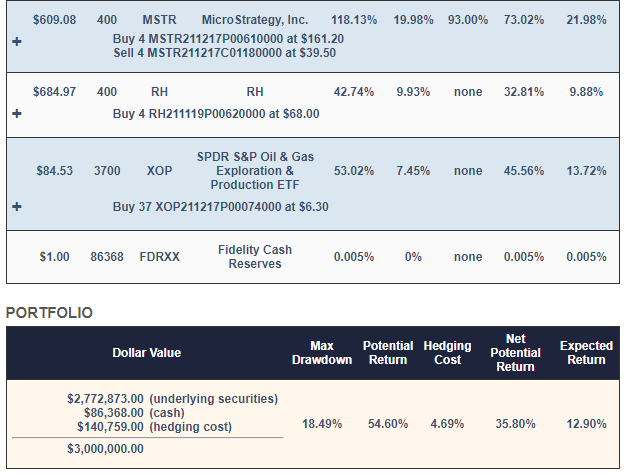
With this, your maximum drawdown over the next six months - that is, if every underlying security went to zero - would have been a decline of 18.49%. Your best case scenario was a gain of about 36%, and your expected return (a more likely scenario) was a gain of a little under 13% in six months.
Why Those Securities?
Each trading day, our system analyzes total returns and options market sentiment to estimate potential returns for thousands of stocks and ETFs. The Amplify Transformational Data Sharing ETF BLOK, Avis Budget Group, Inc. CAR, the Direxion Daily S&P Oil & Gas Exp. & Prod. Bull 2X Shares ETF GUSH, MGM Resorts International MGM, MicroStrategy, Inc. MSTR, RH RH, and the SPDR S&P Oil & Gas Exploration & Production ETF XOP were selected because they were among our top names: the ones that had the highest potential returns, net of hedging costs. Our system started with roughly equal dollar amounts of each, and then rounded them down to round lots, to reduce hedging costs. It swept up most of the leftover cash from the rounding-down process into a tightly hedged iPath Series B Bloomberg Coffee Subindex Total Return ETN JO position, to further reduce hedging cost.
Why Those Hedges?
On our website, if you click the plus signs in the portfolio above, the positions expand to give you a better look at the hedges. For example, this is what the CAR position looked like expanded.


CAR was hedged with an optimal, or least expensive, put option. A few of the other positions were hedged with optimal collars. Our system estimates returns both ways to determine which type of hedge is best. We elaborated on that process in a previous post: When To Hedge With Puts Versus Collars.
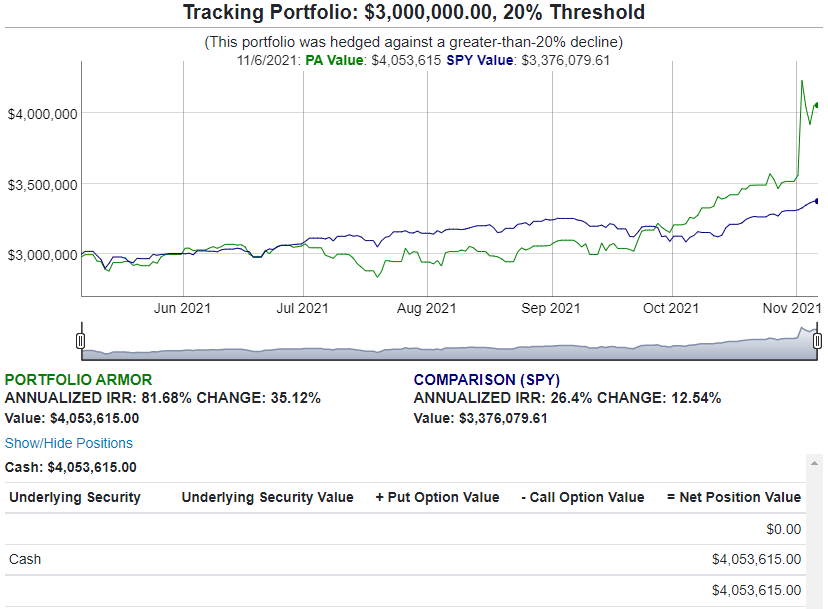
How The Portfolio Performed
The portfolio returned 35.12% over six months, net of hedging and trading costs, versus SPY which returned 12.54% over the same time period.
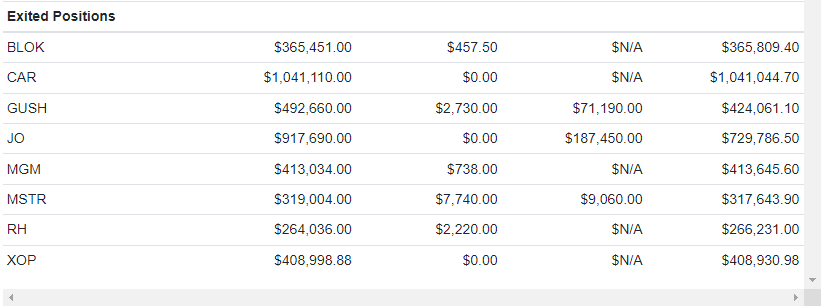
CAR Drove Outperformance
The best performer of the underlying securities in this portfolio was CAR. Because it was one of only 8 underlying securities in the portfolio, and because our algorithm hedged it with optimal puts, the portfolio was able to capture all of its outperformance, as the rental car stock's price shot up.
Edge Rankings
Price Trend
© 2025 Benzinga.com. Benzinga does not provide investment advice. All rights reserved.
Trade confidently with insights and alerts from analyst ratings, free reports and breaking news that affects the stocks you care about.

