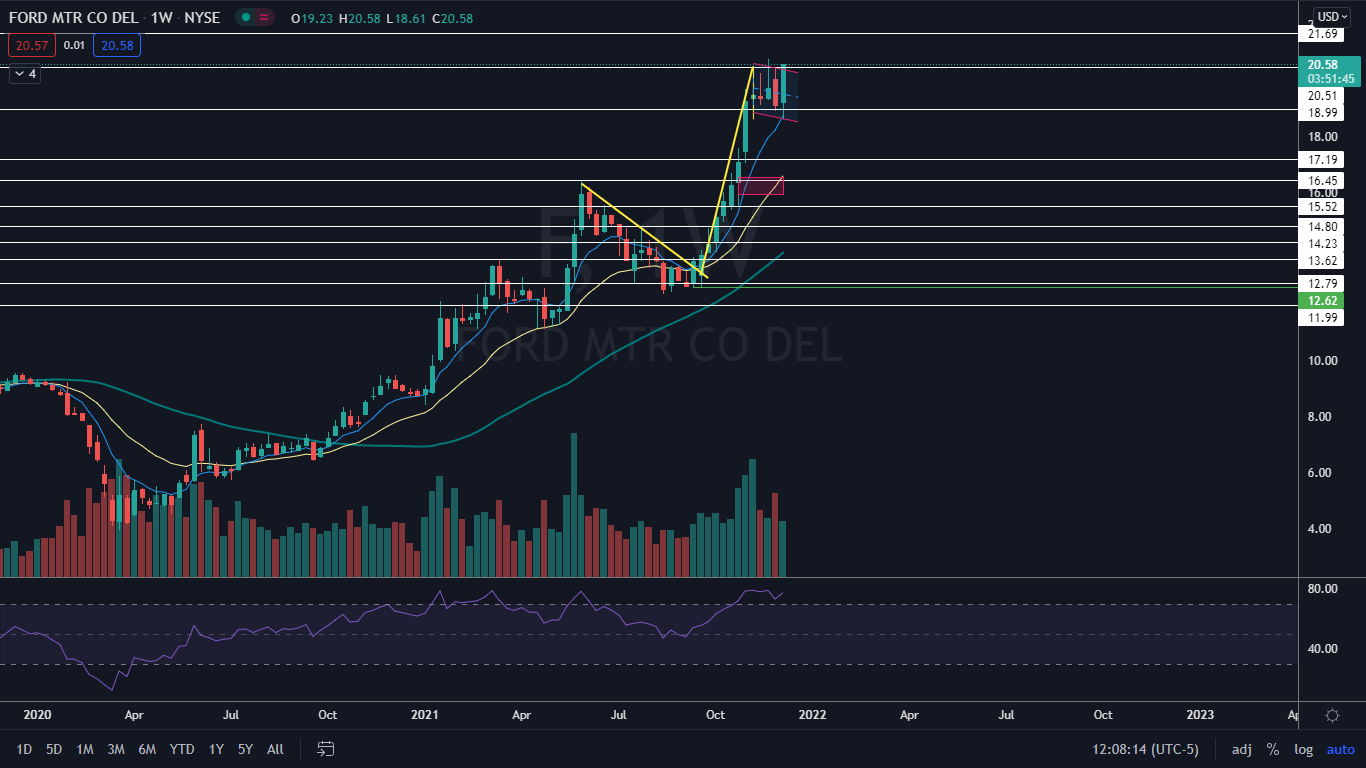
Ford Motor Co F and Tesla, Inc TSLA have both formed weekly chart patterns that could provide clues to their future direction for the long-minded trader and investor.
Ford has formed a bull flag pattern while Tesla has settled into a bearish downtrend. As more and more legacy automakers continue the switch to electric vehicles, there is a possibility Tesla will lose its sector dominance and stocks such as Ford and General Motors Company GM have begun to decouple from Tesla’s price movements.
It should be noted, however, that events affecting the direction of the general markets, positive or negative reactions to earnings prints and news headlines about a stock can quickly invalidate patterns. As the saying goes, "the trend is your friend until it isn't" and any trader position should have a clear stop set in place and manage their risk versus reward.
On Thursday, Ford CEO Jim Farley, appearing on CNBC’s "Investing Club" with Jim Cramer, said the Detroit-area automaker has the framework in place to bridge the gap between Ford and Tesla by increasing its EV production. Ford has a fair bit of catching up to do, however, because the automaker sold just 11,116 electric vehicles in November compared to Tesla, which sold 52,859 vehicles in China alone.
See Also: EV Sales Are On The Rise, But Tesla's Global Market Share Is Shrinking: Analyst
The Ford Chart: Ford has created a weekly bull flag pattern with the pole formed between the week of Sept. 20 and Nov. 8 and the flag between Nov. 8 and Friday.
- On Friday, Ford was attempting to break up bullishly from the upper descending trendline of the flag pattern on high volume, which indicates the pattern is likely recognized.
- Ford will need to break up through a resistance level at $20.51 to power higher.
- There is a gap on the daily chart bullish traders should be aware of between $15.92 and $16.55 because it is likely Ford will trade down into the range in the future, although it could be an extended amount of time before that happens.
Want direct analysis? Find me in the BZ Pro lounge! Click here for a free trial.

The Tesla Chart: After reaching an all-time high of $1,243.49 on Nov. 4, Tesla entered into a downtrend on the weekly chart, although the trend is less clear on the daily.
- The most recent lower high was printed the week of Nov. 22 at the $1,201.95 level and the most recent lower low of $950.50 was created this week.
- The weekly candle looks to be a doji, which indicates Tesla may trade higher next week although the stock will need to pop up over the $12,50 level to negate the downtrend.
- There are two gaps on Tesla’s chart that are likely to fill in the future, with the first falling between $910 and $944.20 range and the second between $1,197 and $1,208.

Photo: Caleb Oquendo from Pexels
Edge Rankings
Price Trend
© 2025 Benzinga.com. Benzinga does not provide investment advice. All rights reserved.
Trade confidently with insights and alerts from analyst ratings, free reports and breaking news that affects the stocks you care about.