Apple Inc AAPL shares were trading slightly lower Monday morning, as the stock received a price target upgrade. One JPMorgan analyst maintained the Overweight rating on the stock and raised the price target to $210.
By publication on Monday, Apple was down 0.58% at $178.41.
See Related: You Ask, We Analyze: Can Amazon's Stock Catch Up To Apple And Break To New Highs?
Apple Daily Chart Analysis
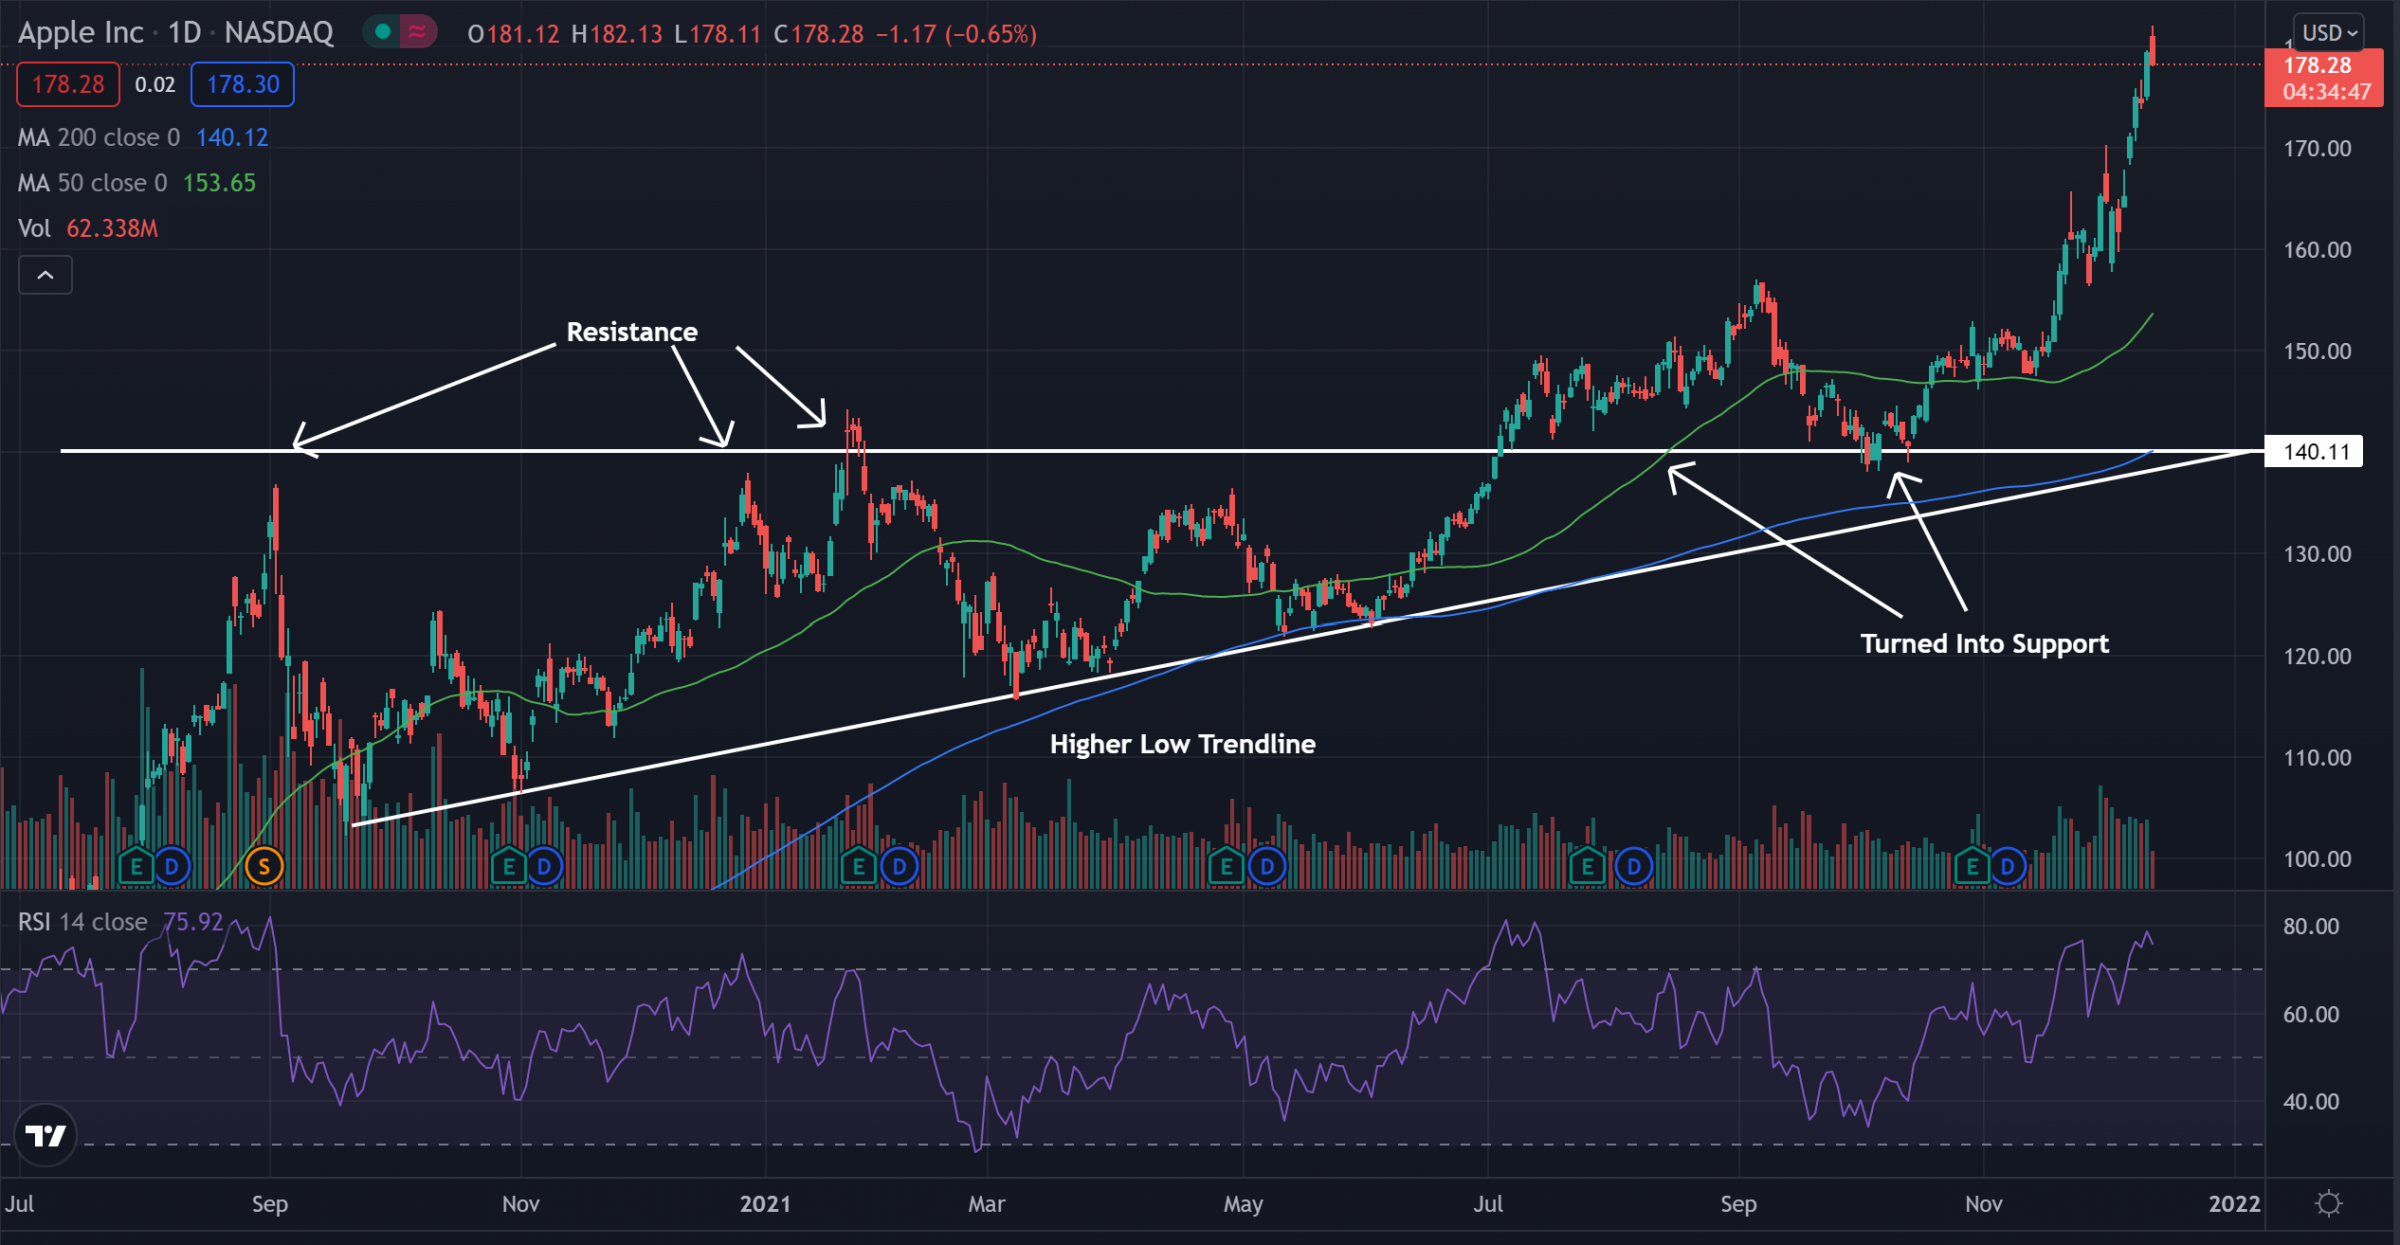
- Shares have broken out of what traders call an ascending triangle pattern and have pushed higher since the day of the breakout in an almost parabolic manner.
- The stock trades above both the 50-day moving average (green) and the 200-day moving average (blue). This indicates bullish sentiment, and each of these moving averages may hold as an area of support in the future.
- The Relative Strength Index (RSI) has been climbing the past few weeks and sits at 78 on the chart. This shows that the stock is continuing to see more buyers enter the market. The RSI is well into the overbought range and is seeing selling pressure heavily outweighed by the buying pressure.

What’s Next For Apple?
Apple stock has been pushing higher after breaking above the ascending triangle pattern and looks to have begun to move parabolically. This parabolic movement may show that Apple stock is due to cool off a bit and consolidate again some time in the future. A period of consolidation may be what the stock needs to continue on its run higher.
Photo by Moritz Kindler on Unsplash
© 2025 Benzinga.com. Benzinga does not provide investment advice. All rights reserved.
date | ticker | name | Price Target | Upside/Downside | Recommendation | Firm |
|---|
Trade confidently with insights and alerts from analyst ratings, free reports and breaking news that affects the stocks you care about.