NVIDIA Corporation NVDA shares are trading lower Tuesday as shares pullback from having a strong day Monday. Many chipmaker stocks had a bullish session after a weekend report from the Semiconductor Industry Association showed November sales of $51.7 billion.
Nvidia was down 4.40% at $287.96 Tuesday at publication.
Nvidia Daily Chart Analysis
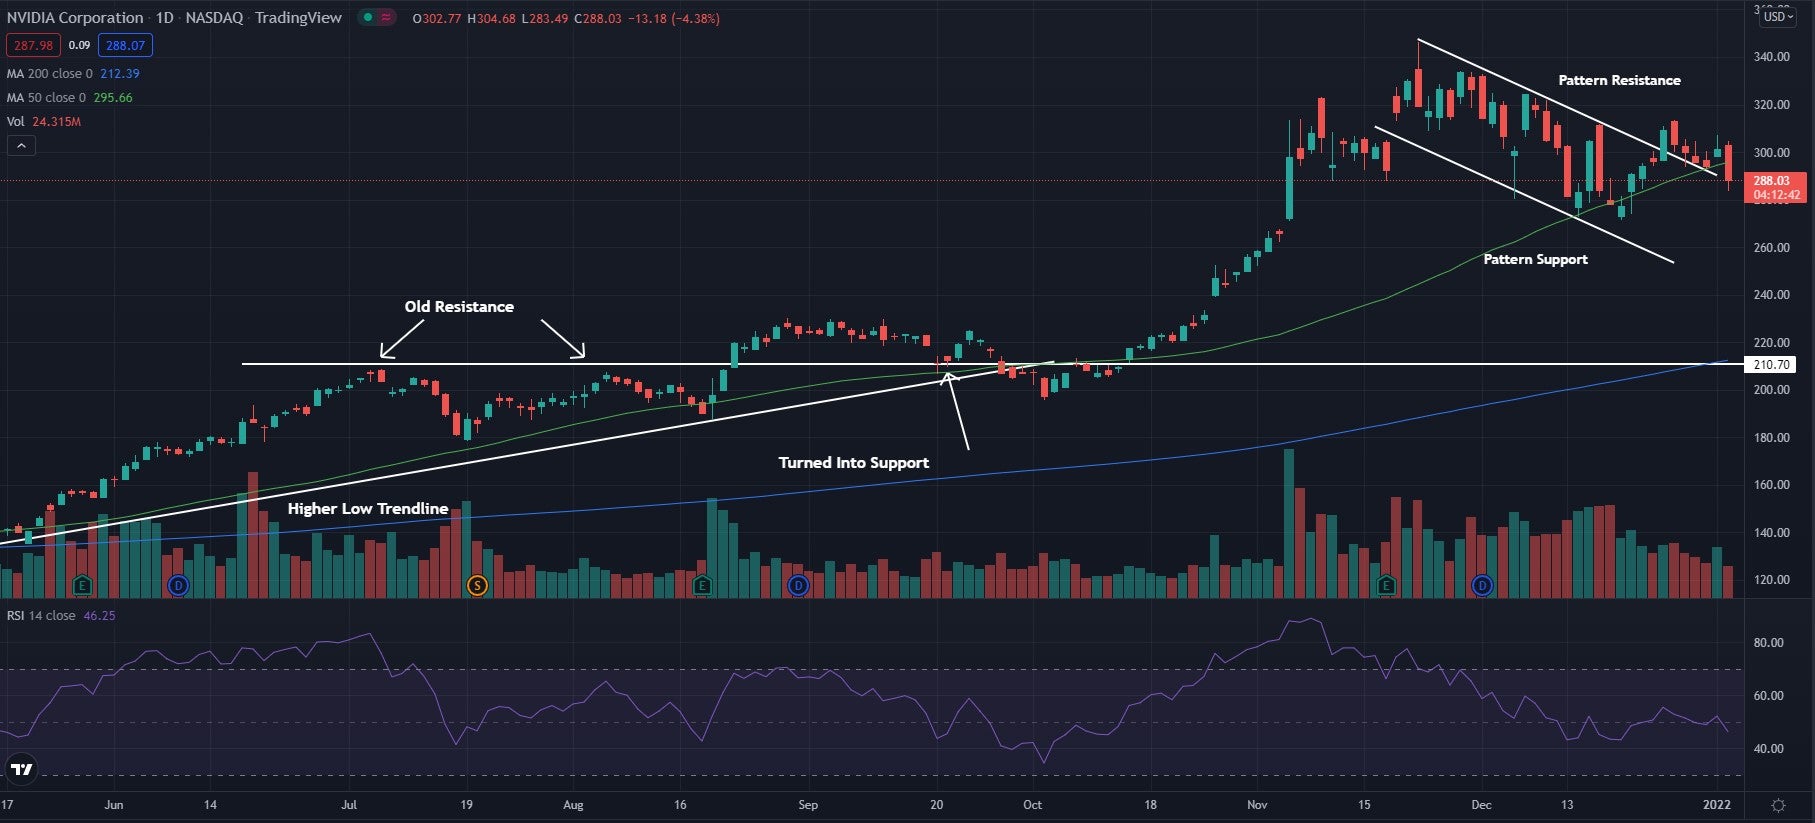
- The stock looks to be breaking out of what traders call a bullish flag pattern. The stock has crossed pattern resistance and is attempting to consolidate above the level. If the stock sees strong volume it could see a strong bullish push.
- The stock crossed below the 50-day moving average (green) but trades above the 200-day moving average (blue), indicating the stock is in a period of consolidation. The 50-day moving average may act as a place of resistance, while the 200-day moving averages may hold as support.
- The Relative Strength Index (RSI) has been moving sideways and now sits at 47. This shows that the amount of buying pressure and selling pressure is almost equivalent and has been for the past couple of weeks.

What’s Next For Nvidia?
The stock is seeing some sideways movement after having a bullish run for a time. The stock has traded in a bullish flag for a time and could be breaking out of it. This flag pattern could be followed with another bullish move if the volume can see a few strong days.
Bulls are looking for this push and want to see the stock make a move higher. Bears are looking to see the stock fall back into the flag pattern and be unable to break resistance once again. This could lead to a strong downward move.
Photo: Courtesy Nvidia
Edge Rankings
Price Trend
© 2025 Benzinga.com. Benzinga does not provide investment advice. All rights reserved.
Trade confidently with insights and alerts from analyst ratings, free reports and breaking news that affects the stocks you care about.