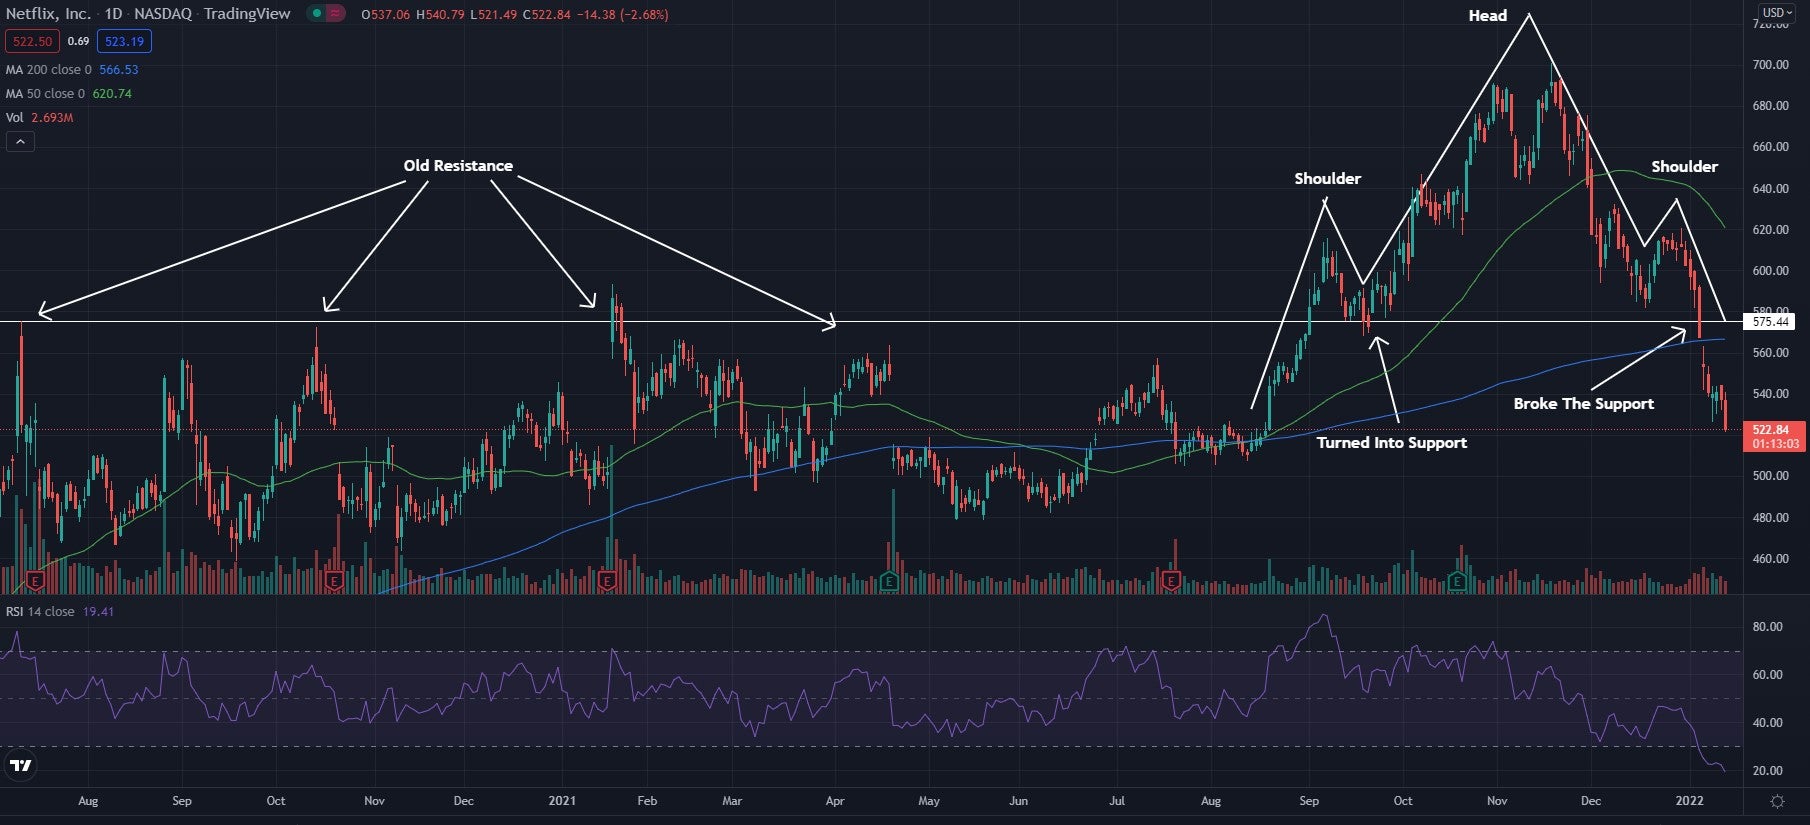
Netflix Inc. NFLX traded lower Thursday and has recently fallen below a support level confirming what traders call a head and shoulders pattern.
Netflix closed down 3.3% at $519.20.
See Also: Netflix OKs Back-To-Back Sequels For 'Red Notice'
Netflix Daily Chart Analysis
- Shares fell below a key support level near the $575 level, which confirmed the head and shoulders pattern. This pattern is considered a bearish reversal pattern and the confirmation of the pattern hinted that a bearish move was coming.
- The stock trades below both the 50-day moving average (green) and the 200-day moving average (blue). This indicates bearish sentiment, and each of these moving averages may hold as an area of resistance in the future.
- The Relative Strength Index (RSI) has been steadily falling for the past few months and now sits at 19 on the indicator. This shows the stock is well into the oversold region and that sellers keep pouring into the market. If the RSI continues to stay in the oversold region, the price of the stock will likely keep falling.

What’s Next For Netflix?
Netflix crossing below the support line hinted that a strong bearish move was coming as a break below support in a head and shoulders pattern is textbook for a bearish move to follow.
Bulls are looking for the stock to find some support and make a bounce and begin to head higher once again. Bulls are looking for higher lows and a cross above the moving averages for sentiment to turn bullish once again.
Bears are in full control of the stock and want to see the stock continue to fall and hold below the moving averages.
© 2025 Benzinga.com. Benzinga does not provide investment advice. All rights reserved.
Trade confidently with insights and alerts from analyst ratings, free reports and breaking news that affects the stocks you care about.