

Sofi Technologies Inc. SOFI shares were trading lower Tuesday after several companies in the broader financial services sector moved down in sympathy with Goldman Sachs Group Inc. GS, which reported worse-than-expected quarterly results.
Sofi was down 7.58% at $12.20 late in Tuesday's session.
See Also: How To Buy Sofi Stock
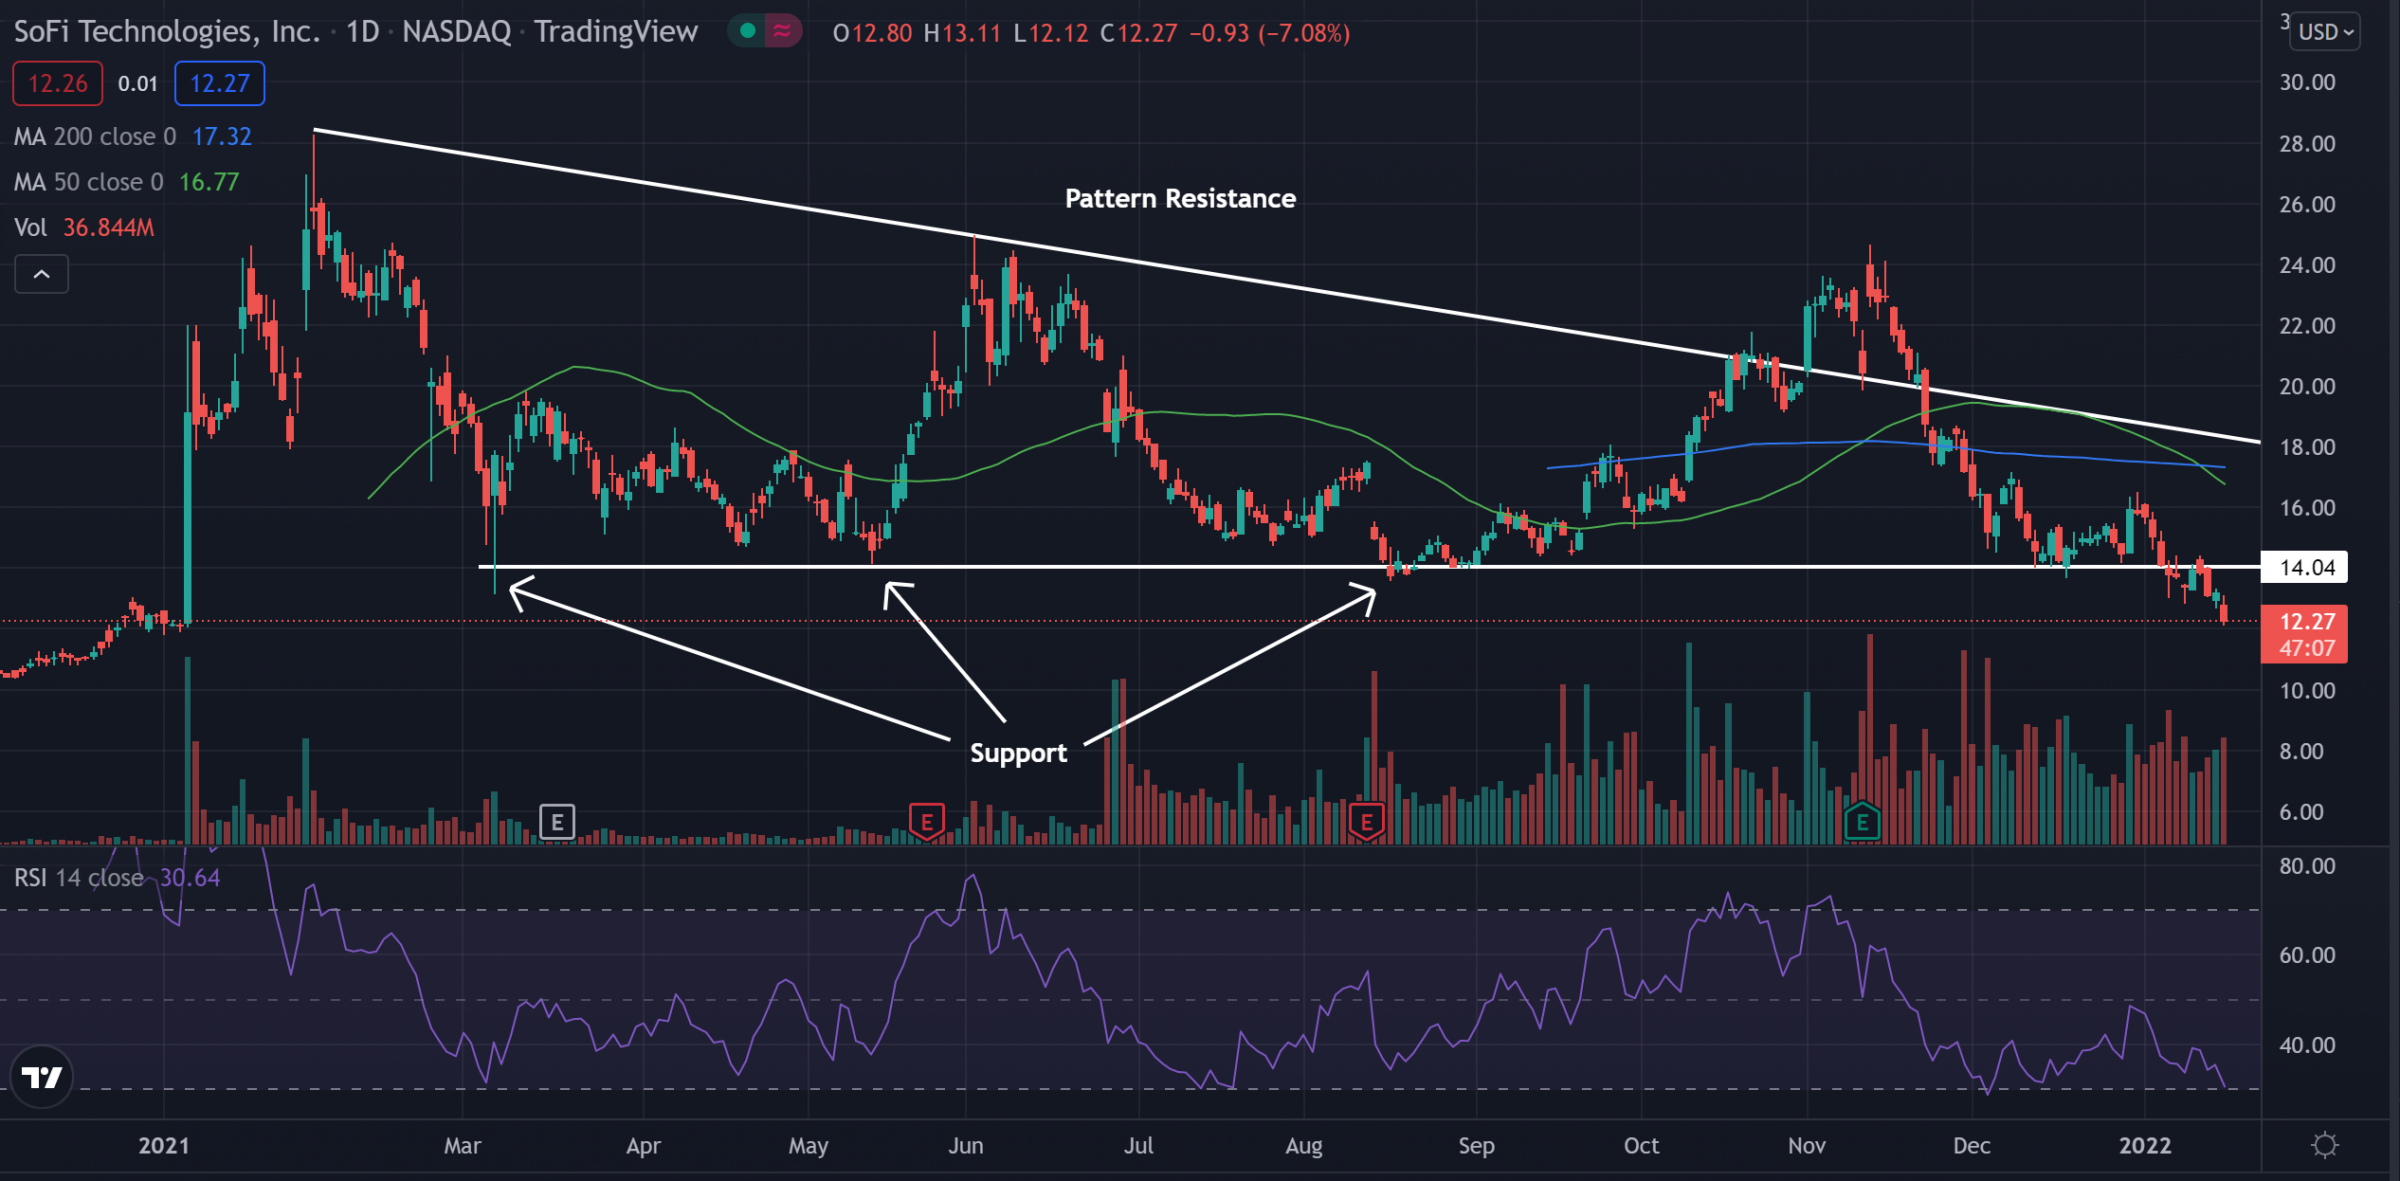
Sofi Daily Chart Analysis
- The stock price has fallen below support in what traders call a descending triangle pattern. Support was near the $14 level before the break below; this level may now hold as an area of resistance.
- The stock trades below both the 50-day moving average (green) and the 200-day moving average (blue). This indicates bearish sentiment, and each of these moving averages may hold as an area of resistance in the future.
- The Relative Strength Index (RSI) has been falling lower and now sits at 31 on the indicator. This shows that sellers have been moving into the market and pushing the stock down. If the RSI stays in this area the price may continue to drop lower.
What’s Next For Sof?
The break below the support level shows that bears have been moving into the stock. If this support level becomes an area of resistance it may confirm the descending triangle pattern. This could cause a further strong bearish push in the stock’s future. Bears are looking for this confirmation and for the stock to be able to hold below the moving averages. Bulls would like to see the stock begin to turn around and start to form higher lows, crossing back above the $14 level in time.
© 2025 Benzinga.com. Benzinga does not provide investment advice. All rights reserved.
Trade confidently with insights and alerts from analyst ratings, free reports and breaking news that affects the stocks you care about.

