


Coinbase Global, Inc COIN was trading higher on Wednesday morning, up 1.35% at $224.99, after closing Tuesday’s session down 3.49% lower amid market weakness in both the SPDR S&P 500 SPY and the cryptocurrency sector.
On Tuesday, Coinbase and Mastercard Incorporated MA announced a partnership that will allow Coinbase customers to use their Mastercard credit and debit cards to purchase non-fungible tokens on the crypto exchange’s upcoming NFT marketplace.
The move will make buying NFTs less complicated for customers of the exchange because they will no longer need to convert fiat to a digital currency in order to complete their transactions.
Both Mastercard and Visa, Inc V have embraced crypto by inking deals with multiple companies in the digital currency sector. Last March, Visa announced a global partnership with Crypto.com and in 2021 Mastercard partnered with a string of crypto-based firms such as BitPay, Gemini and CipherTrace.
Digital currencies were originally designed as a way for people to get around having to rely on banks and governments in order to complete financial transactions, but traditional financial service corporations have welcomed the new asset class as it becomes mainstream.
Despite its popularity, Coinbase’s stock has been beaten down recently and closed Tuesday’s session just 6.27% above its all-time low of $208. That may be set to change, however, if the stock can break up through the falling channel it’s been trading in since reaching a high of $368.90 on Nov. 9.
See Also: Cathie Wood Loads Up In This Crypto Stock As It Crashes 25% On Tuesday — These Are Other Key Trades
The Coinbase Chart: Coinbase has been trading in a fairly consistent downtrend within two parallel lines of a falling channel but has often found support at the median line. A falling channel is considered bearish while the stock remains in the channel, but when the price eventually breaches the upper trendline it can signal that a big upside move may be in the cards.
On Tuesday, Coinbase found buyers below the $222 level, which caused the stock to print a hammer candlestick on the daily chart. The candlestick is frequently found at the bottom of a downtrend and can signal a move to the upside will follow.
Coinbase’s relative strength index (RSI) is measuring in at about 34%. When a stock’s RSI nears or reaches the 30% level it becomes oversold, which can be a buy signal for technical traders, although the level can remain extended for long periods of time.
Coinbase is trading below the eight-day and 21-day exponential moving averages (EMAs), with the eight-day EMA trending below the 21-day, both of which are bearish indicators. The stock is also trading well below the 50-day simple moving average, which indicates longer-term sentiment is bearish.
Want direct analysis? Find me in the BZ Pro lounge! Click here for a free trial.
- Bulls want to see big bullish volume come in and pop Coinbase up above the eight-day EMA, which may give the stock the power needed to break the falling channel. There is resistance above at $237.01 and $248.49.
- Bears want to see Coinbase continue to reject the upper trendline of the channel until the pattern pushes the stock to a new all-time low. Coinbase has support at $213 and $208.
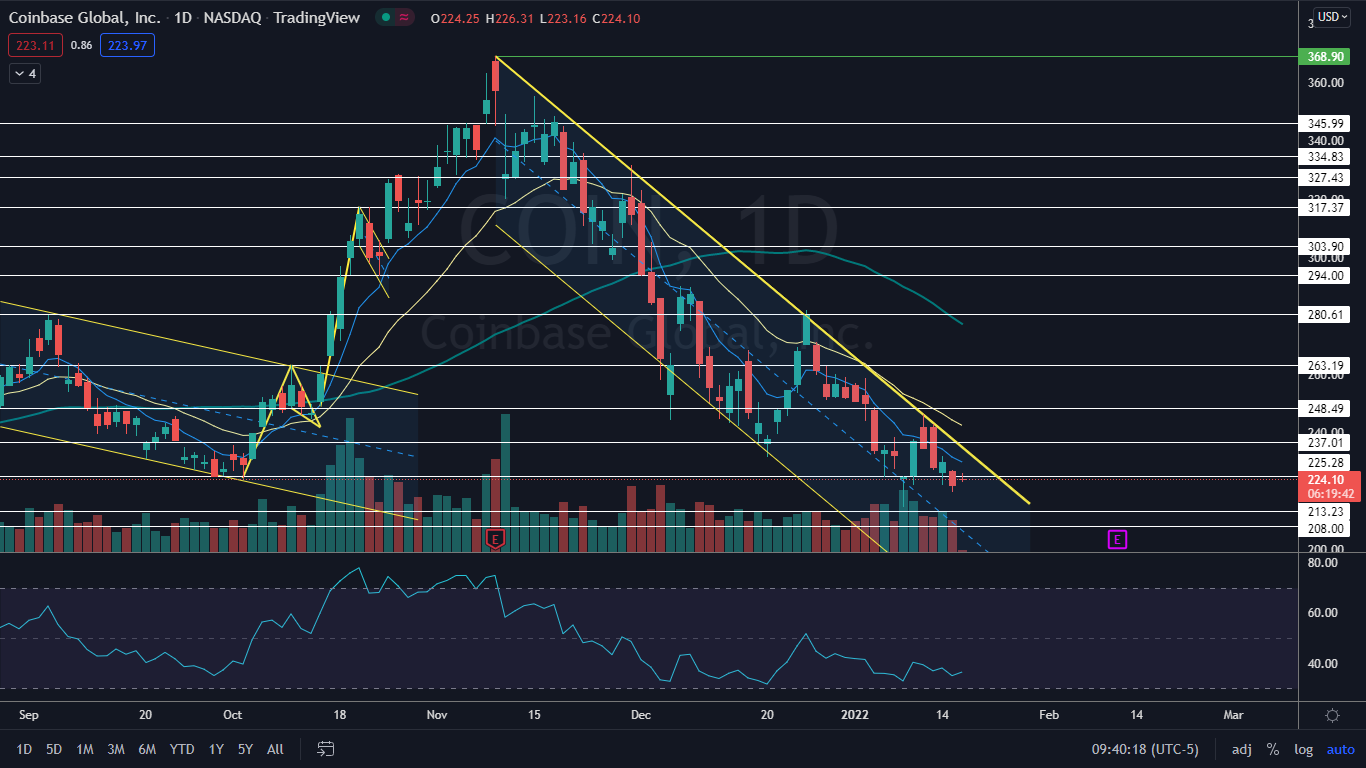
Photo: Courtesy of Marco Verch Professional on Flickr.
© 2025 Benzinga.com. Benzinga does not provide investment advice. All rights reserved.
Trade confidently with insights and alerts from analyst ratings, free reports and breaking news that affects the stocks you care about.

