Shiba Inu SHIB/USD shares are trading lower Thursday in a crypto market that is seeing a strong bearish day. The crypto is falling alongside Dogecoin DOGE/USD, another popular dog coin — and inspiration for Shiba — that is crashing much harder.
Shiba Inu was down 2.93% at $0.000021 over a 24-hour period as of Thursday afternoon.
See Related: Ethereum Whales Buy $88M Shiba Inu Tokens
Shiba Inu Daily Chart Analysis
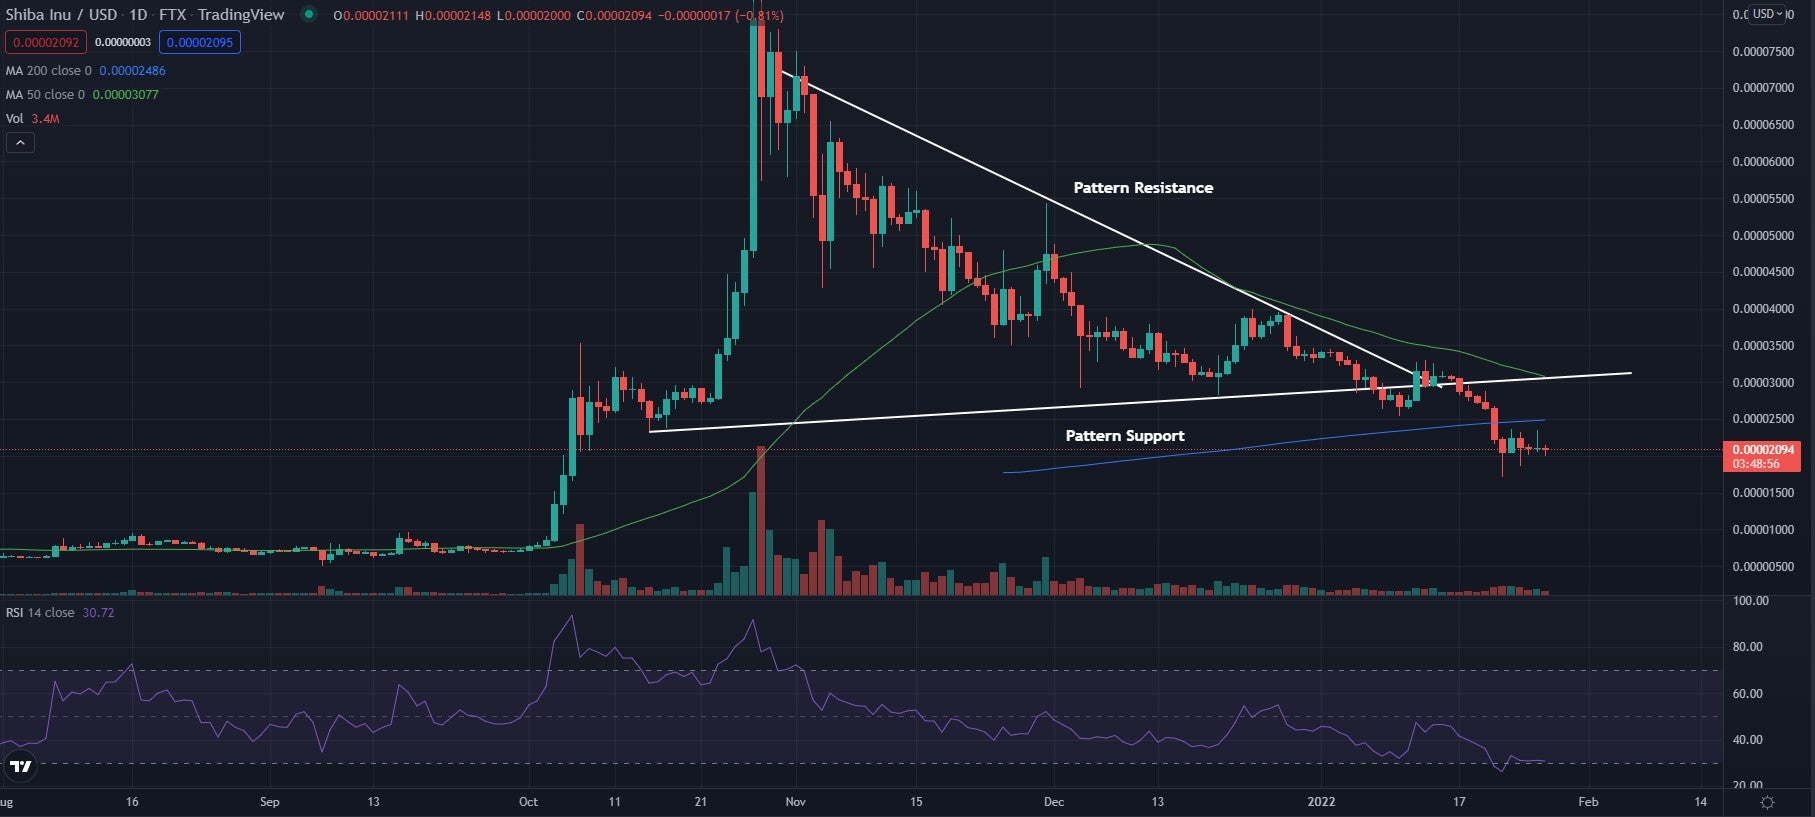
- Shiba Inu has fallen below the pattern support in what traders call a pennant pattern. The crypto has also recently fallen below the 200-day moving average, showing the stock is seeing more bearish sentiment.
- The crypto trades below both the 50-day moving average (green) and the 200-day moving average (blue). This shows the crypto is trading with bearish sentiment, and each of these moving averages may hold as an area of resistance in the future.
- The Relative Strength Index (RSI) continues to trend lower throughout the last few months and sits at 30 on the indicator. This shows the RSI is on the border of the oversold region and is showing the crypto is dominated by sellers. If the RSI continues to stay in the oversold region, the price may keep falling.

What’s Next For Shiba Inu?
Shiba Inu is seeing more bearish momentum after crossing below the pattern support line. This support line may act as an area of resistance now. More bearish momentum occurred after crossing below the 200-day moving average. Bearish traders are looking to see the crypto hold below the 200-day moving average and continue to trend lower.
Bullish traders are looking to see a cross back above the moving averages for sentiment to turn bullish once again. Bulls are then looking for the price to push above the pattern support line and begin to form higher lows once again.
© 2025 Benzinga.com. Benzinga does not provide investment advice. All rights reserved.
Trade confidently with insights and alerts from analyst ratings, free reports and breaking news that affects the stocks you care about.