Zinger Key Points
- Starbucks’ stock hasn’t reacted to unionization news in the past and the stock was reacting to a bullish pattern it printed at the $93.79 level.
- Starbucks is trading above the eight-day exponential moving average (EMA) but below the 21-day EMA, which indicates indecision but provides extra support at the eight-day EMA.
- Find out which stock just claimed the top spot in the new Benzinga Rankings. Updated daily— discover the market’s highest-rated stocks now.
Starbucks Corporation SBUX was trading about 3% highe Tuesday in a possible attempt to reverse course into an uptrend after plummeting over 20% between Jan. 3 and Jan. 28.
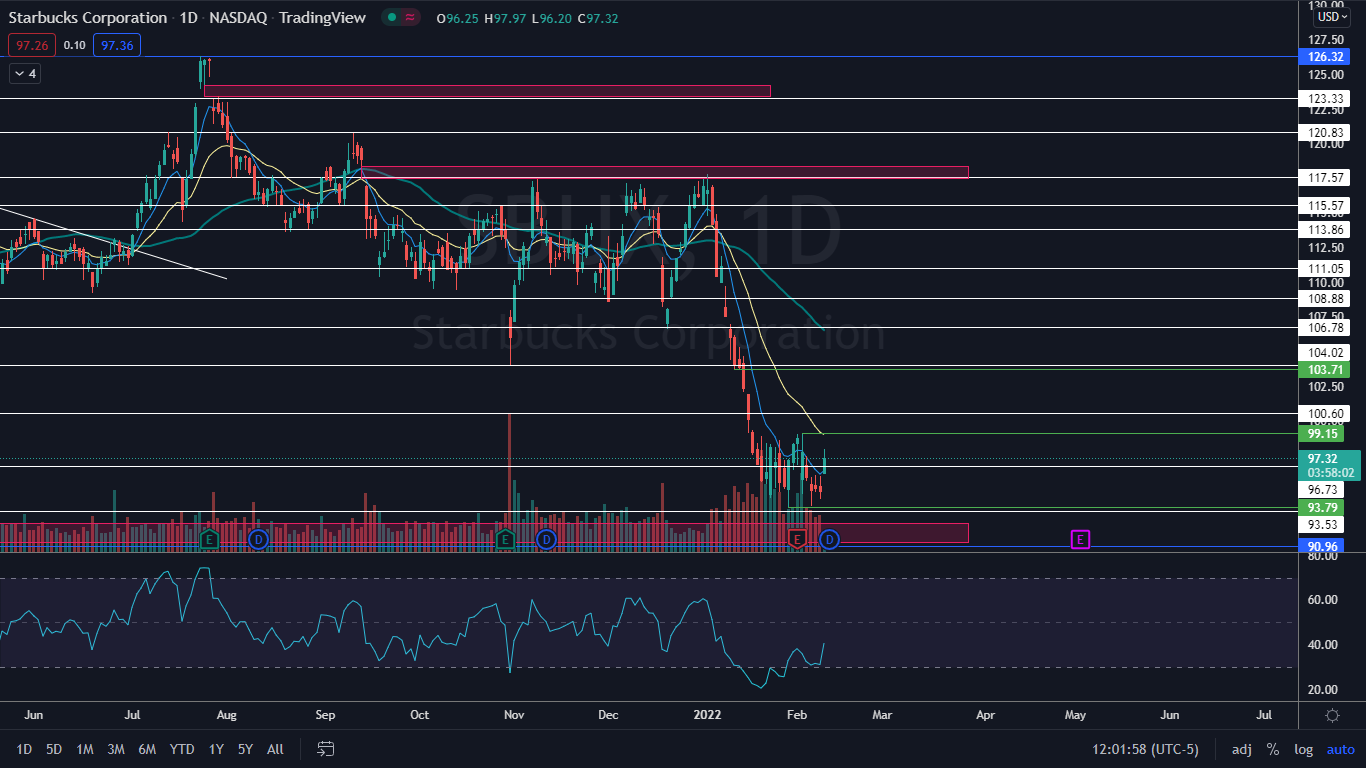
The stock has since consolidated its sharp decline by trading in a tight horizontal pattern between the low of $93.79 and a high at the $99.15 level for seven trading days.
On Tuesday, th coffee chain fired a number of employees from its Poplar/Highland location in Memphis, citing safety and security policy violations. Starbucks spokesperson Reggie Borges told Forbes the employees escorted a cameraperson from a local news agency inside the store after business hours and opened a store safe.
The union that represents employees at locations in Buffalo, Starbucks Workers United, released a post on Twitter that said Starbucks Corporate fired “virtually the entire union leadership” and accused the management of retaliation.
Unionization efforts by Starbucks employees has been gaining momentum across the U.S. with employees at least 54 locations filing paperwork to pursue elections. In December, the Buffalo store at 933 Elmwood Ave made history by becoming the first unionized store.
Starbucks’ stock hasn’t reacted to unionization news in the past, however, and on Wednesday the stock was reacting to a bullish pattern it printed at the $93.79 level.
See Also: 'I Just Don't See Any Money To Be Made': Why This Investor Sold Out Of Starbucks Stock
The Starbucks Chart: On Jan. 28 and Feb. 4, Starbucks printed a bullish double tweezer bottom pattern at that level and on Monday and Tuesday consolidated sideways before breaking up from the pattern on Wednesday. Next, the stock will need to break up from the horizontal pattern and if Starbucks closes the trading session near its high-of-day price, it will print a bullish kicker candlestick, which could indicate higher prices will come again on Thursday.
The move higher on Wednesday has caused Starbucks’ relative strength index (RSI) to lift up from the 30% level. When a stock’s RSI reaches or falls below the 30% area it becomes oversold, which can be a buy signal for technical traders.
Starbucks has a number of gaps on its chart with the closest lower gap between $91.20 and $92.66 and the closest upper gap falling between the $117.47 and $118.36 range. Gaps on charts fill about 90% of the time so it's likely Starbucks will trade into both ranges in the future, although bullish traders would like to see the stock close the lower gap to feel more confident going forward.
Starbucks is trading above the eight-day exponential moving average (EMA) but below the 21-day EMA, which indicates indecision but provides extra support at the eight-day EMA. The stock is trading well below the 50-day simple moving average, which indicates longer-term sentiment is bearish.
Want direct analysis? Find me in the BZ Pro lounge! Click here for a free trial.
- Bulls want to see sustained big bullish volume push the stock up out of the sideways trading pattern, which will cause Starbucks to regain support at the 21-day EMA. There is resistance above at $100.60 and $104.02.
- Bears want to see big bearish volume come in and drop Starbucks down into the lower gap, which will also push the stock into a confirmed downtrend. The stock has support below at $96.73 and $93.53.

Edge Rankings
Price Trend
© 2025 Benzinga.com. Benzinga does not provide investment advice. All rights reserved.
Trade confidently with insights and alerts from analyst ratings, free reports and breaking news that affects the stocks you care about.