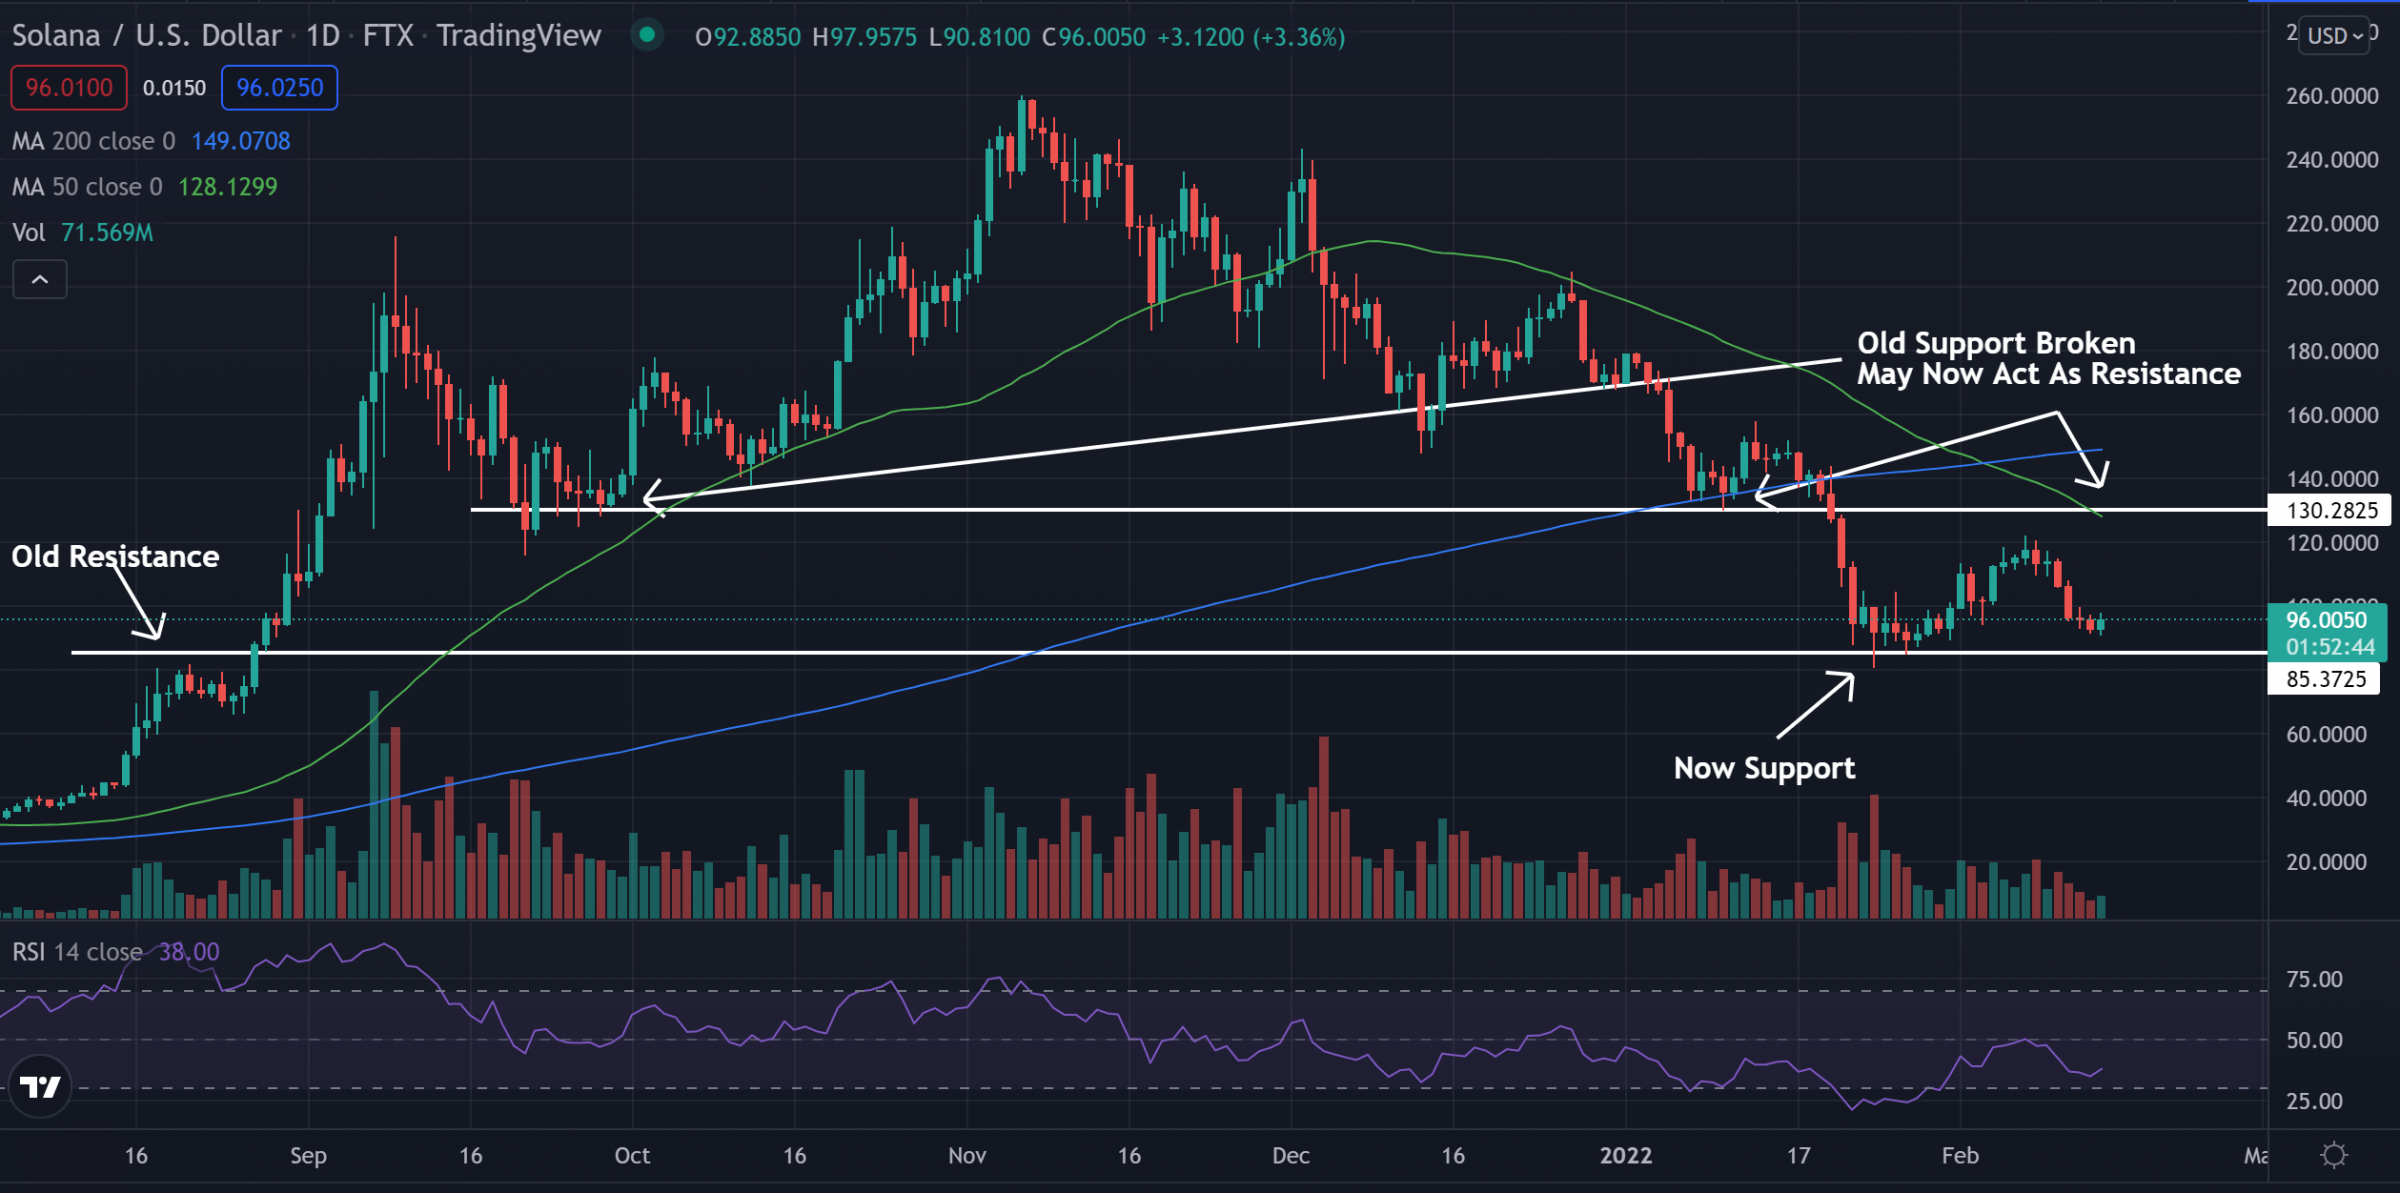
Solana SOL/USD, an Ethereum ETH/USD rival, is trading higher Monday as it looks like it could be at the start of a bounce. The $85 area has been a key area on the chart in the past and the crypto is looking to hold above this area once more. Falling volume may show the downward trend of the past few days is coming to a halt.
Solana was up 3.58% at $96.71 Monday afternoon at publication.
See Also: Solana Price Predictions
Solana Daily Chart Analysis
- Solana bounced off support in a sideways channel as it has had a strong green day. The $85 level has been an area of support in the past and the crypto could confirm a bounce if it can close above today’s highs in the next couple of days.
- The crypto trades below both the 50-day moving average (green) and the 200-day moving average (blue). This shows Solana is trading with bearish sentiment and each of these moving averages may hold as an area of resistance in the future.
- The Relative Strength Index (RSI) is beginning to form a higher low as it now sits at 37. The increasing RSI shows that more buyers have been entering the market, although there still remain more sellers overall.

What’s Next For Solana?
Solana could have a bounce off support or it could continue the downward trend and break below the support. To confirm the bounce of support, the crypto will need to see a future daily candle close above the high of the day today.
Bulls are looking to see the higher lows continue to form and the crypto heads toward the $130 resistance. Bearish traders are looking to see the price dip below the $85 level and begin to hold it as a resistance for a possible further strong bearish move.
Edge Rankings
Price Trend
© 2025 Benzinga.com. Benzinga does not provide investment advice. All rights reserved.
Trade confidently with insights and alerts from analyst ratings, free reports and breaking news that affects the stocks you care about.