


McDonalds Corporation MCD has been in the spotlight recently after posting a cryptic photo on Twitter that caused Dogecoin DOGE/USD enthusiasts to speculate the fast-food giant may announce it would begin accepting the crypto for payment at its restaurants during its Super Bowl ad. When the ad aired, many found themselves disappointed with the absence of any Dogecoin reference.
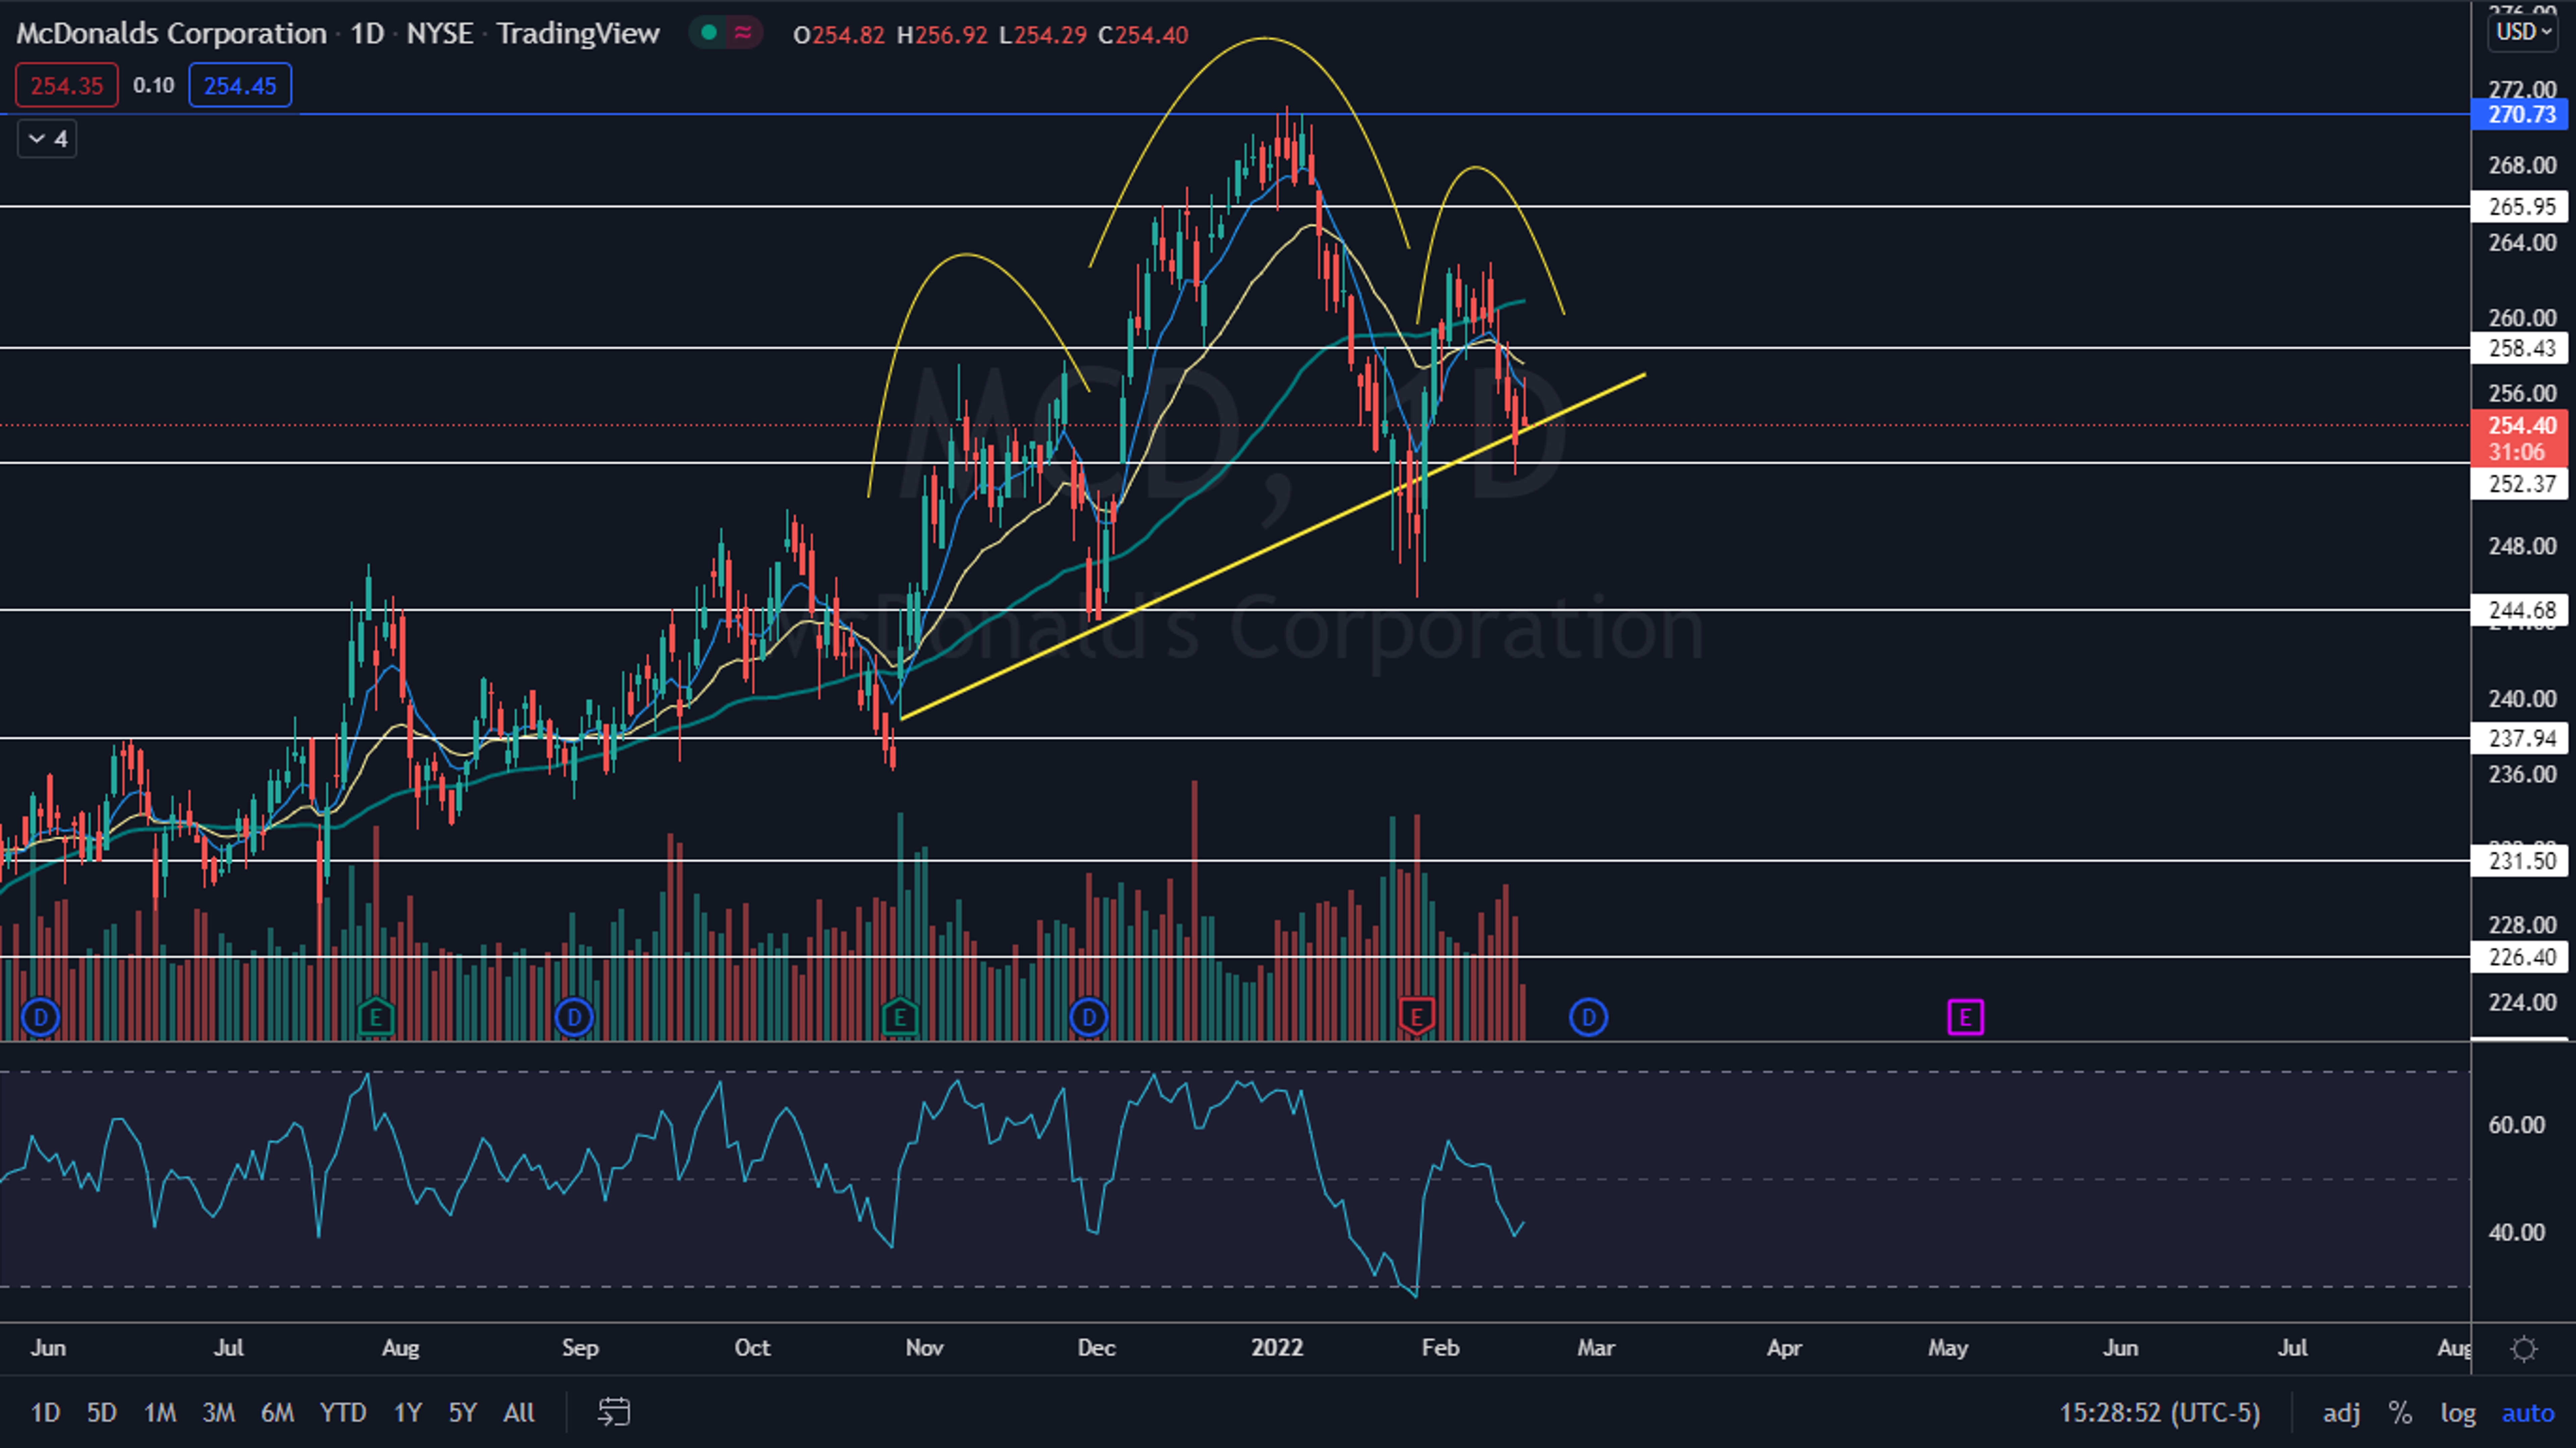
- On Monday, McDonalds’ stock fell 1.65% intraday before popping back up to close the trading session just above an ascending trendline that has been holding the stock mostly up since Oct. 27, 2021.
- The trendline may be the neckline of a large bearish head-and-shoulders pattern on the daily chart, with the left shoulder created between Oct. 27 and Dec. 1, the head formed between Dec. 2 and Jan. 27 and the right shoulder created between Jan. 28 and Tuesday.
- If the pattern is recognized, the measured move is about 10%, which indicates McDonalds could fall toward the $223 level in the future.
- Traders can watch for a break down from the neckline on higher-than-average volume to indicate whether the pattern was recognized.
- McDonalds has resistance above at $258.43 and $265.95 and support below at $252.37 and $244.68.

Loading...
Loading...
MCDMcDonald's Corp
$287.40-0.77%
Edge Rankings
Momentum
66.20
Growth
80.16
Quality
Not Available
Value
17.53
Price Trend
Short
Medium
Long
© 2025 Benzinga.com. Benzinga does not provide investment advice. All rights reserved.
Benzinga simplifies the market for smarter investing
Trade confidently with insights and alerts from analyst ratings, free reports and breaking news that affects the stocks you care about.
Join Now: Free!
Already a member?Sign in

