Zinger Key Points
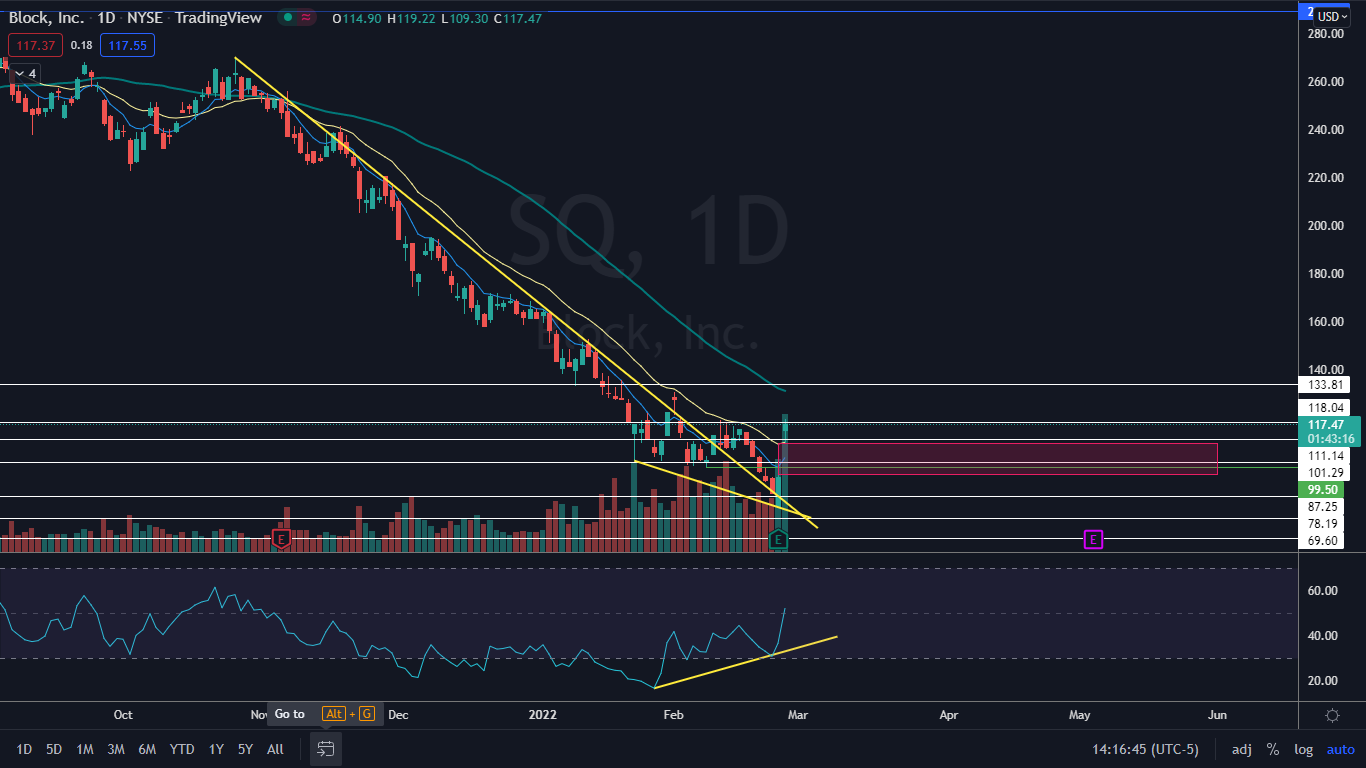
- On Feb. 9, Block broke up bullishly from a descending trendline that had been holding the stock down since Oct. 26, 2021.
- The stock then traded lower to back test the trendline as support and on Thursday printed a bullish engulfing candlestick on the daily chart, which indicated higher prices would come on Friday.
- Get Pro-Level Earnings Insights Before the Market Moves
Block, Inc SQ gapped up 20% higher on Friday and ran an additional 5% intraday after reporting better-than-expected financial results for the fourth quarter.
The financial services and mobile payments company reported earnings per share of 27 cents, which beat the estimate of 22 cents, and revenue of $4.08 billion compared to the consensus estimate of $685.45.
The earnings beat prompted a number of analysts to update their ratings and price targets for Block. The firms maintained their positive ratings but lowered their price targets to between $155 and $240. Even the lowest price target represents a 31% move to the upside from the current share price, however.
Despite Friday’s bullish move, Block will remain susceptible to the movement of the overall market. And although the SPDR S&P 500 SPY was trading higher on Friday, the markets aren’t out of the woods yet with uncertainty surrounding the Ukraine crisis and the likelihood of rate hikes beginning in March.
See Also: Here's How Jack Dorsey's Square Fared On The Bitcoin Front In The Latest Quarter
The Block Chart: On Feb. 9, Block broke up bullishly from a descending trendline that had been holding the stock down since Oct. 26, 2021. The stock then traded lower to back test the trendline as support and on Thursday printed a bullish engulfing candlestick on the daily chart, which indicated higher prices would come on Friday.
Block had also developed bullish divergence on the chart, with the stock making lower lows while the relative strength index made a series of higher lows. Bullish divergence is sometimes found at the bottom of a downtrend and can indicate a reversal to the upside is on the horizon.
After gapping up, Block didn’t run into a group of sellers or profit takers, which has left an empty trading range below. Gaps on charts fill 90% of the time, so it’s likely Block will trade down toward the $96.16 area in the future. If Block fills the gap when it prints its next higher low, it could provide a solid entry point for bulls not already in a position as long as a reversal candlestick prints above that level.
Block is trading above the eight-day and 21-day exponential moving averages (EMAs), but with the eight-day EMA trending below the 21-day. Bulls will want to see the eight-day EMA eventually cross back above the 21-day to feel more confident going forward.
Want direct analysis? Find me in the BZ Pro lounge! Click here for a free trial.
- Bulls also want to see an uptrend develop, with Block printing a higher low above the $83 level. There is resistance above at $118.04 and $133.81.
- Bears want to see big bearish volume come in and drop the stock down below the $83 level, which would indicate the recent price action was a bull trap and the downtrend will continue. Block has support below at $111.14 and $101.29.

Photo courtesy of Block.
© 2025 Benzinga.com. Benzinga does not provide investment advice. All rights reserved.
Trade confidently with insights and alerts from analyst ratings, free reports and breaking news that affects the stocks you care about.