Zinger Key Points
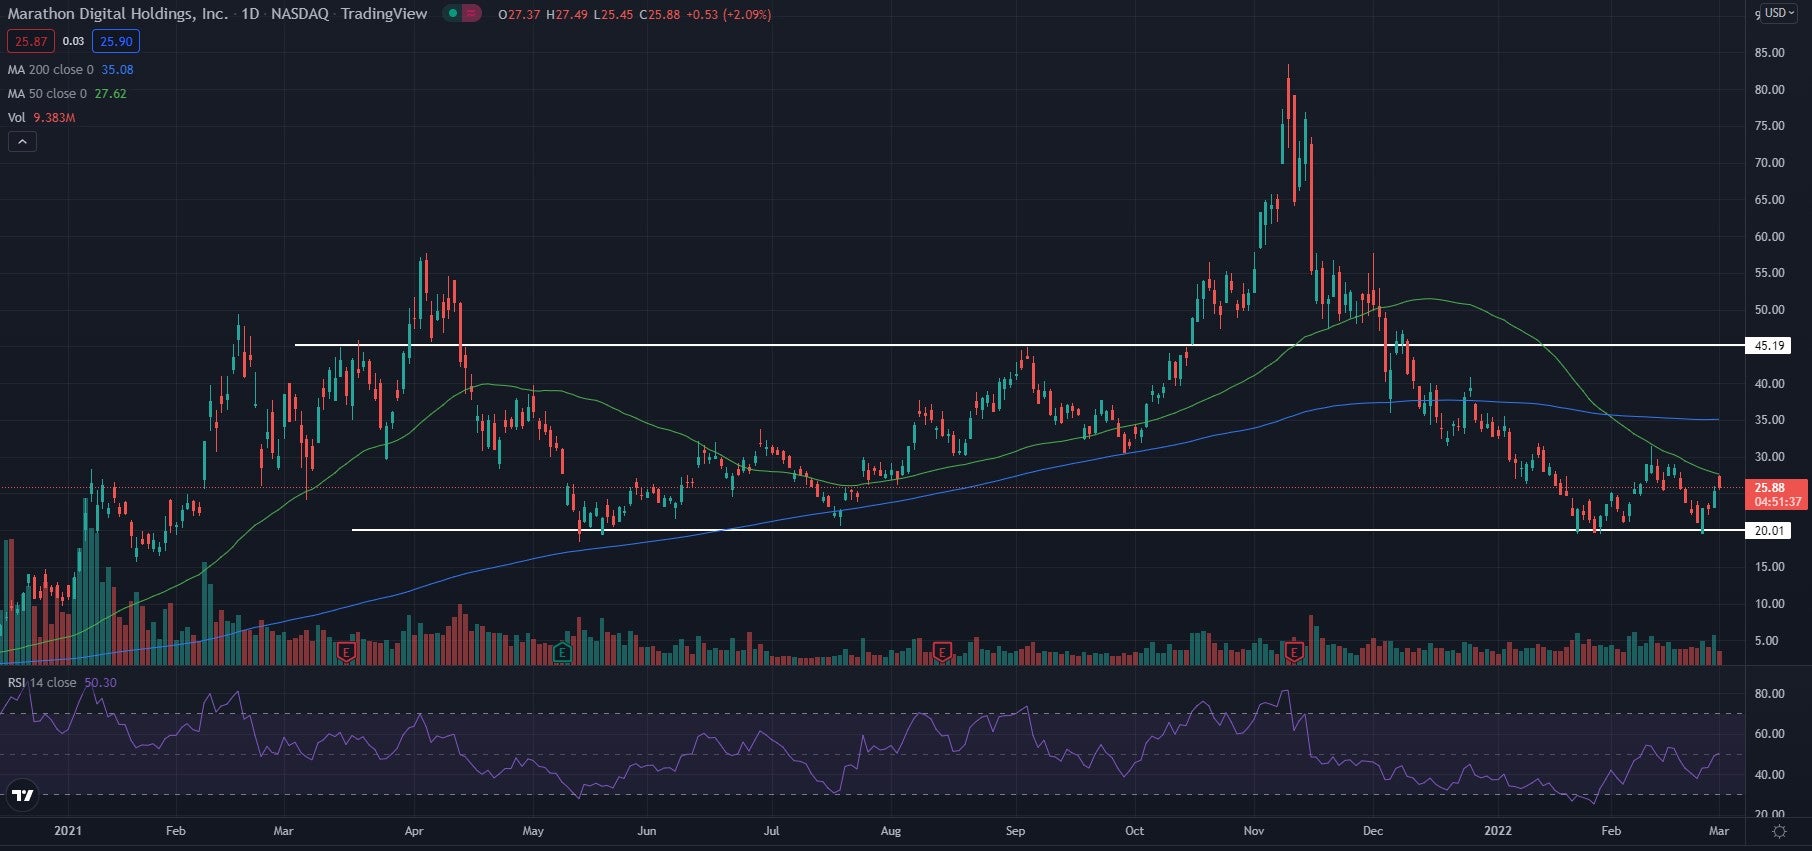
- The stock has been climbing over the last few days after bouncing off the $20 level again, forming what traders may call a double bottom.
- This movement higher along with the RSI on the rise shows that the stock may be ready to head higher soon if the momentum can continue.
- Get Wall Street's Hottest Chart Every Morning
Marathon Digital Holdings Inc. MARA shares were trading higher Tuesday as the Bitcoin and Ethereum mining stock trades higher in sympathy with Bitcoin BTC/USD and Ethereum ETH/USD.
The crypto market is flying higher today, as Bitcoin was able to cross back above the $40,000 level once again.
Marathon Digital stock was up 0.26% at $25.42 midday Tuesday.
Marathon Digital Daily Chart Analysis
- The stock has been pushing higher in the last few days after it was able to bounce off support in a sideways channel.
- The stock was able to find support near the $20 level, as this has been an area of support in the past. The stock may find resistance near the $45 level in the future, as it has been an area where the stock has struggled to hold above.
- The stock trades below both the 50-day moving average (green) and the 200-day moving average (blue), indicating the stock’s sentiment has been bearish. Each of these moving averages may hold as an area of resistance in the future.
- The Relative Strength Index (RSI) has been climbing throughout the past few weeks and sits at 50. This shows equal buying pressure and selling pressure is equal, meaning that neither buyers or sellers have the upper hand although buyers have been pushing into the stock in recent weeks.

What’s Next For Marathon Digital?
The stock has been climbing over the last few days after bouncing off the $20 level again, forming what traders may call a double bottom. This movement higher along with the RSI on the rise shows that the stock may be ready to head higher soon if the momentum can continue.
Bullish traders are looking to see higher lows continue to form as well while the RSI keeps climbing. Bearish traders want to see the stock get rejected at the 50-day moving average and start heading back toward the $20 level once again, and eventually break below it and hold the level as resistance.
© 2025 Benzinga.com. Benzinga does not provide investment advice. All rights reserved.
Trade confidently with insights and alerts from analyst ratings, free reports and breaking news that affects the stocks you care about.