


Zinger Key Points
- If Ethereum breaks up from the bull flag pattern, it is likely to create a higher high above the March 18 high of $2,987.
- Ethereum could skyrocket up toward the $3,400 level, a price the crypto has not traded at since Jan. 16.
- China’s new tariffs just reignited the same market patterns that led to triple- and quadruple-digit wins for Matt Maley. Get the next trade alert free.
Ethereum ETH/USD has settled into a bullish flag pattern on the daily chart. The bull flag pattern is created with a sharp rise higher forming the pole, which is then followed by a consolidation pattern that brings the stock lower between a channel with parallel lines.
- For bearish traders, the "trend is your friend" (until it's not) and the stock may continue downwards within the following channel for a short period of time. Aggressive traders may decide to short the stock at the upper trendline and exit the trade at the lower trendline.
- Bullish traders will want to watch for an upward break from the upper descending trendline of the flag formation, on high volume, for an entry. When a stock breaks up from a bull flag pattern, the measured move higher is equal to the length of the pole and should be added to the lowest price within the flag.
A bull flag is negated when a stock closes a trading day below the lower trendline of the flag pattern, or if the flag falls more than 50% down the length of the pole.
The Ethereum Chart: On March 14, Ethereum closed on the upper trendline of a descending triangle pattern and broke up bullishly from the pattern on the following day. The rise between that date and March 18, combined with the mostly sideways consolidation in the days since, has settled the crypto into a bull flag pattern on the daily chart.
- The measured move on a break of the pattern is almost 20%, which indicates Ethereum could skyrocket up toward the $3,400 level, a price the crypto has not traded at since Jan. 16. Traders can watch for a break of the upper descending trendline of the flag to come on higher-than-average volume to indicate that the pattern was recognized.
- If Ethereum breaks up from the bull flag pattern, it is likely to create a higher high above the March 18 high of $2,987, which would further confirm the new uptrend that Benzinga called out on Sunday.
- Ethereum has resistance above at $3,057 and $3,240 and support below at $2,890 and $2,609.
Want direct analysis? Find me in the BZ Pro lounge! Click here for a free trial.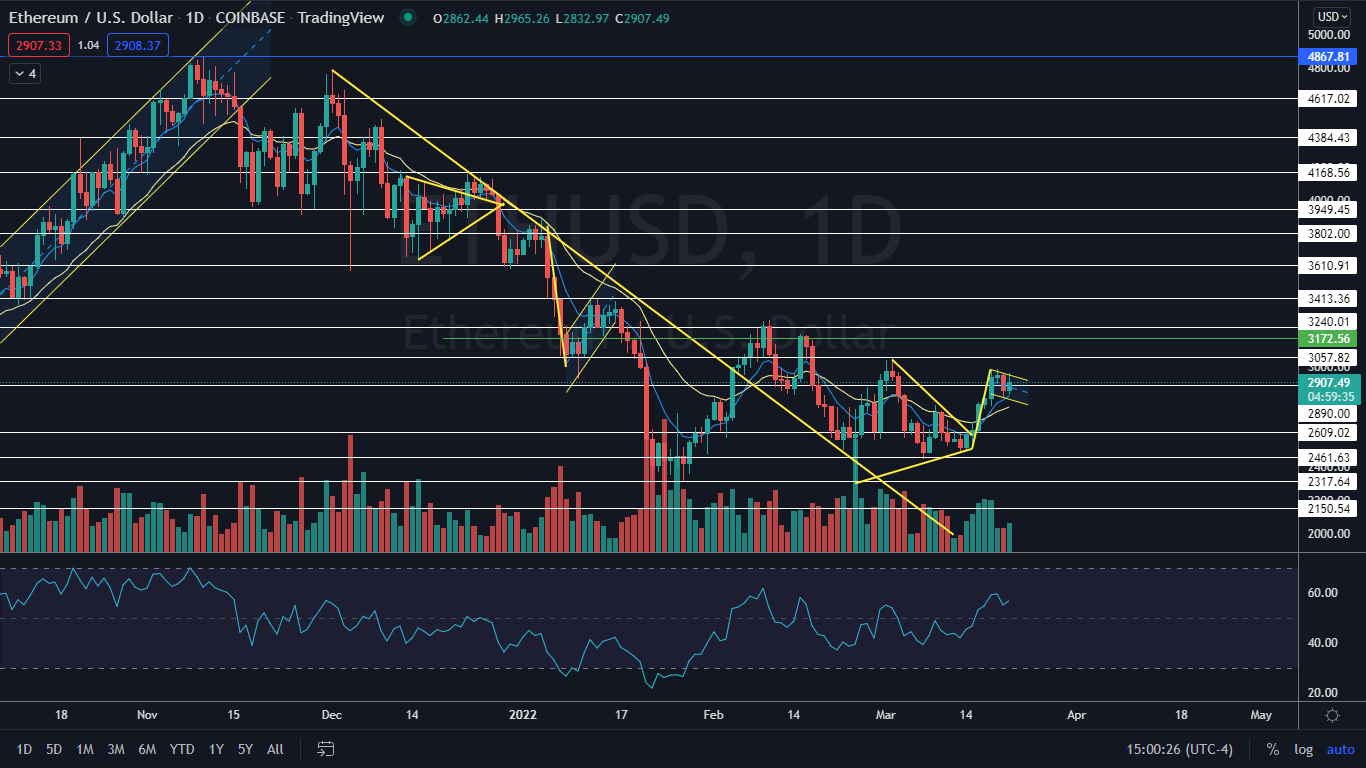
Photo: Courtesy of CryptoWallet.com Images on Flickr
Edge Rankings
Price Trend
© 2025 Benzinga.com. Benzinga does not provide investment advice. All rights reserved.
Trade confidently with insights and alerts from analyst ratings, free reports and breaking news that affects the stocks you care about.

